
Shovel-ready is a wage question before it is a permitting one
Texas and California employ almost exactly the same number of construction and extraction workers. The median wage in one is 49,170 dollars and in the other 71,670. A national cost per mile that ignores that is not a cost estimate.
by
Vantage point
I write from the editor's desk of this brief, and my only access to these labour markets is the same public occupational file any reader can download.
Published 7 minute read

Illustration : The Cefa Brief
Texas employs 674,000 people in Construction and Extraction Occupations. California employs 672,770. The two workforces are within two thousand people of each other, which on a base of two-thirds of a million is as close to identical as two state labour markets get. The median annual wage in Texas is 49,170 dollars. In California it is 71,670. The same occupational group, the same year, the same federal survey, a gap of 22,500 dollars per worker at the middle of the distribution.
I lead with that pair because it is the cleanest refutation I know of the way infrastructure cost is usually discussed. A great deal of argument about why American projects cost what they do runs on process: permits, reviews, litigation, procurement rules, the number of agencies that must sign. Those are real. But before any of them binds, a project has to buy labour in a specific place at a specific price, and that price is not close to uniform across the country.
The same occupation, priced twice
Across all 51 jurisdictions the median for this group runs from 82,440 dollars in Hawaii to 45,870 dollars in Arkansas. That is a spread of 1.8 to one for work that is described by the same occupational codes and, in most respects, done with the same tools. Narrow it to the ten states that employ the most of these workers and the spread is still 1.6 to one, from 80,570 dollars in Illinois to 49,170 in Texas.
Those ten states were chosen by headcount, not by wage, which matters. If I had picked the extremes I would be showing you the tails of a distribution. Instead this is where most of the work is: the ten largest construction and extraction workforces in the country, and their medians refuse to line up.
It is worth saying what this file does not contain. It publishes 51 state figures for the group and no national one. There is no United States row, no average of the states, no weighted national median. So when a cost model carries a national construction wage, that number came from somewhere other than here, and the first question about it is which places it was built from and in what proportion. The federal survey that produced these state medians declines to hand anyone a single number for the country, and the reason is visible in the spread.
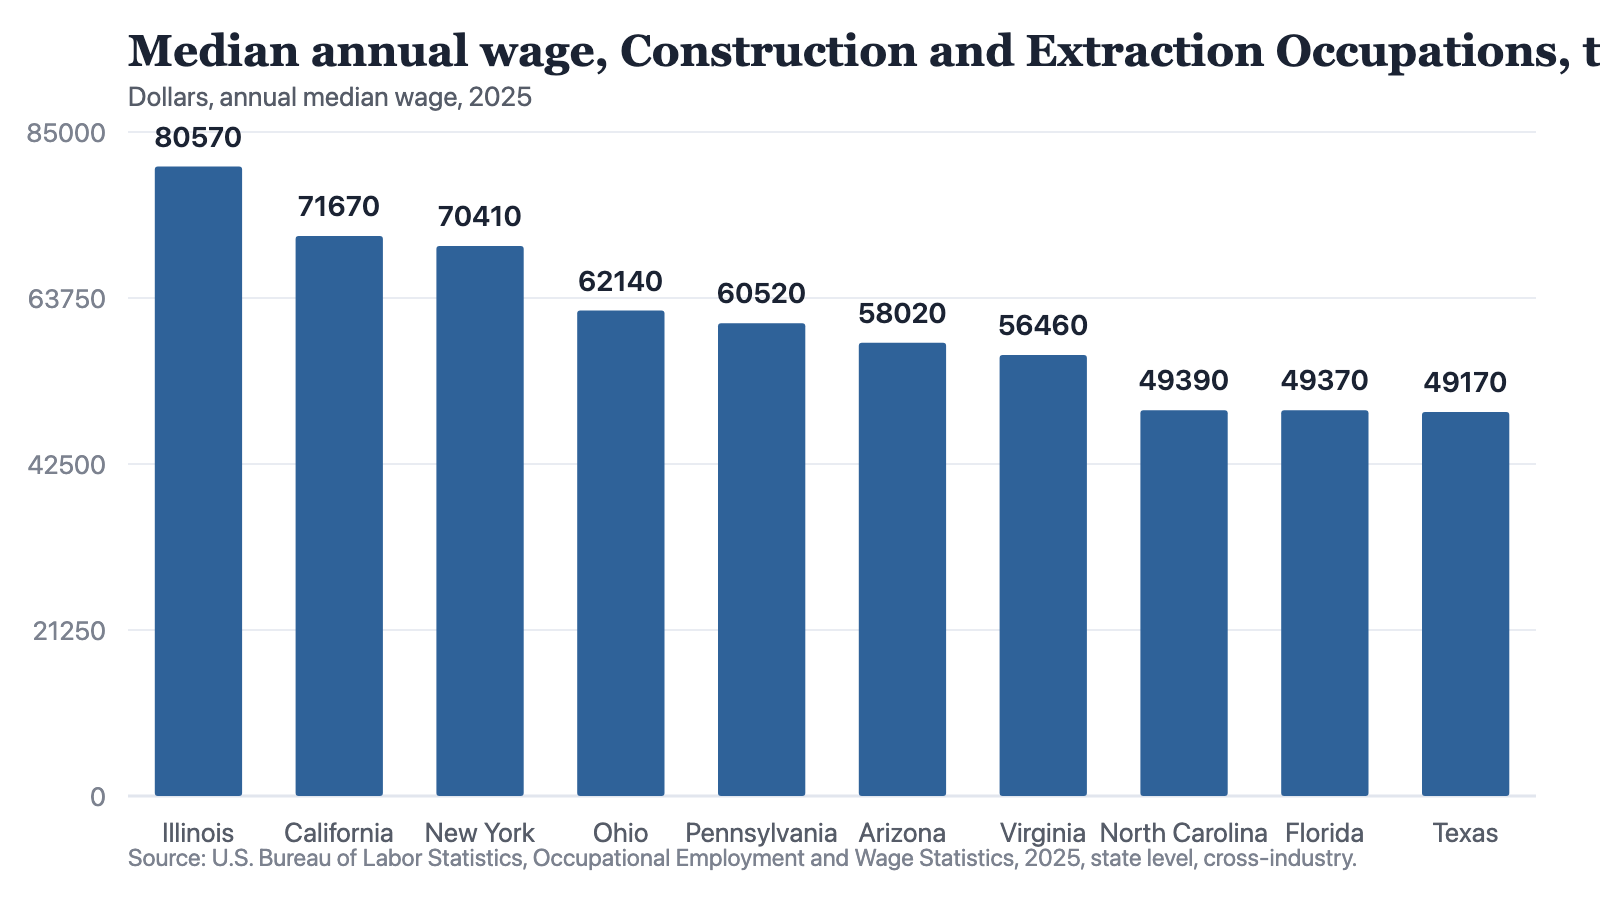
Notes: U.S. Bureau of Labor Statistics, Occupational Employment and Wage Statistics, 2025, state level, cross-industry. A median is the middle worker's wage, not a labour rate and not a payroll cost.
Source: The Cefa Brief
Chart description
Ten bars, descending by wage. Illinois 80,570 dollars, California 71,670, New York 70,410, Ohio 62,140, Pennsylvania 60,520, Arizona 58,020, Virginia 56,460, North Carolina 49,390, Florida 49,370, Texas 49,170. The four largest of these workforces by headcount - Texas 674,000, California 672,770, Florida 462,050 and New York 319,930 - appear at both ends of the wage order, so size of workforce and level of wage are not moving together.
Ten bars, descending by wage. Illinois 80,570 dollars, California 71,670, New York 70,410, Ohio 62,140, Pennsylvania 60,520, Arizona 58,020, Virginia 56,460, North Carolina 49,390, Florida 49,370, Texas 49,170. The four largest of these workforces by headcount - Texas 674,000, California 672,770, Florida 462,050 and New York 319,930 - appear at both ends of the wage order, so size of workforce and level of wage are not moving together.
Read the chart against the headcounts and the absence of a pattern is the finding. The four biggest workforces are Texas, California, Florida and New York. Two of them sit at the bottom of the wage order and two at the top. Whatever sets the wage, it is not how many of these workers a state has.
Two cautions before anyone builds on this. The group blends construction with extraction; the file does not separate them, so a state with substantial mining or drilling is showing a blended figure, and the states where that blending matters most are not identified here. And a median wage is not a labour cost. It is one worker's pay at the middle of the distribution, with no benefits, no burden, no overtime pattern and no productivity in it. A crew that costs more per hour and finishes sooner may be the cheaper crew, and nothing in this file can tell you whether it is. Anyone converting these numbers into a bid is doing several steps of work the file does not do for them.
The wage is relative to the state, as well
There is a second reading that a cost estimate misses entirely. Set each state's construction and extraction median against that state's all-occupation median wage, and you get what the trade pays relative to everything else available locally.
In Illinois the group's median is 1.55 times the state's overall median - 80,570 against 51,960. In Hawaii it is 1.46 times. In Texas it is 1.01 times: 49,170 against an all-occupation median of 48,620. A Texan choosing between the trades and the rest of the state's labour market is choosing between roughly equal medians. An Illinoisan is choosing between that and half as much again.
In Illinois the trade pays half as much again as the state's median job. In Texas it pays about the same. Those are two different recruiting problems, and no national wage figure contains either of them.
The District of Columbia is the one jurisdiction of the 51 where the group pays below the local median: 70,110 dollars against an all-occupation median of 91,540. It is a small workforce, 12,770 people, in an unusual labour market, and I would not generalise from it. But it makes the point in the sharpest available form. A wage of 70,110 dollars reads as high on a national list and low to the person deciding whether to take the job, and only the second reading determines whether the crew shows up. A construction wage is high or low relative to what else a worker in that place can do, and nothing else.
Why I think this binds before process does
Here is the position, plainly. The constraint on delivery that moves slowest is the workforce. Money can be appropriated in a session. A permitting regime can be rewritten in a session, and several have been. A wage structure and the labour supply behind it cannot be changed by statute at all, in either direction, on any timescale a project schedule recognises.
That asymmetry is why I would rather see a sponsor's labour assumptions than its permitting timeline. The timeline is a schedule risk, and schedule risk is at least visible: everyone in the room knows a review can slip. The labour assumption is the cost base, it is usually a single line in a model, and the file says the cost base varies by 1.6 to one across the states where most of the work happens. A cost base that can be wrong by sixty percent is not a line item. It is the estimate.
The strongest objection is that a wage is a price, and prices do their job. A high construction wage signals scarcity, scarcity draws workers in, and the market clears - so the spread in this file is not a permanent constraint but a snapshot of an adjustment already under way. I take that seriously, and I cannot rebut it from this data. There is one year here. There is no prior-year file, so I cannot show whether high-wage states are drawing workers in or losing them, and I will not pretend otherwise.
What I can say is what the adjustment would have to overcome. Construction labour is licensed, credentialed and unionised differently in every state, and a worker who moves is moving a household, not a tool bag. Whatever rate the market clears at, it does not clear inside the eighteen months between a funding decision and a mobilisation date. On the timescale of a specific project, the wage in the specific place is a given, and treating it as something that will adjust is how a contingency line gets spent before the work starts.
What to ask before quoting a national number
This publication holds one national construction figure: the value put in place, 2.24 trillion dollars in 2024 and the same 2.24 trillion in 2025. It is a useful denominator and it is not a cost estimate for anything. There is no state breakdown of it here, and I have not joined it to the wage data, because a national annual total divided by a state occupational median produces a number with no referent.
- Which state's labour market is this estimate priced in, and what is the median for Construction and Extraction Occupations there?
- Is that median being used as a labour rate? It is not one. What multiplier is being applied for benefits, burden and overtime, and who set it?
- Does the state's figure blend extraction with construction, and if so, is the project's trade mix anything like the state's?
- What does the group pay relative to the state's all-occupation median, and therefore how hard will it be to recruit against every other employer in that market?
- If the estimate was built from a national average, which state's wage is it actually understating, and by how much?
None of those questions requires forecasting anything. All five are answerable from a published federal file and a project's own assumptions, in an afternoon, without a subscription. A sponsor who cannot answer them has priced the work somewhere other than where it will be built, and the gap between those two places is not recoverable later by managing the schedule harder.
The phrase shovel-ready has always described a document: designs finished, approvals in hand, money committed. It has never described a workforce. A project is ready when there are people who will do the work at the price in the model, in the place the work is, and that is a question with a published answer which almost nobody looks up. The answer costs nothing, it is updated every year, and for the ten states where most American construction labour is employed it is the difference between 49,170 dollars and 80,570.
How to cite
Jag DeSaint, "Shovel-ready is a wage question before it is a permitting one," The Cefa Brief, Applied America, 21 octobre 2025, https://applied.thecefa.org/cefa-brief/shovel-ready-is-a-wage-question.
About the author

Each author told us that for this piece they hold no interest a reader would think relevant.
This Perspectives piece carries its author's name because the view in it is the author's own. An editor reviewed it before publication, which is not the same as agreeing with it. It is not a position of the Center for Economics & Foreign Affairs or of Applied America.
© 2025. The author or authors hold the copyright in this Perspectives piece; CEFA publishes it with their permission. This edition, its editing and its presentation are © 2025 Center for Economics & Foreign Affairs. To republish it, see our republication terms. Republishing
Share
The Cefa Brief · applied.thecefa.org/cefa-brief/shovel-ready-is-a-wage-question · Printed from the web edition