
Every infrastructure plan assumes a maintenance workforce it never budgets
Adding up the 51 state estimates gives 6,086,200 people in installation, maintenance and repair. In 50 of those 51 jurisdictions they are paid above the state median wage. A capital programme that treats them as someone else's problem is buying an asset it has not costed to run.
by
Published 4 minute read

Illustration : The Cefa Brief
An infrastructure appraisal is a document about construction. It prices the build, the land, the consents and the financing, and it names a delivery date. What it almost never prices is the workforce that will keep the thing operating for the next thirty years, which is treated as an operating detail to be settled later by somebody else. That workforce is large, well paid by the standards of the places it works in, and already concentrated in exactly the states now being asked to host new energy and industrial capacity.
Adding the 51 state estimates in the 2025 occupational survey gives 6,086,200 people working in installation, maintenance and repair. That is a sum of independently produced state figures rather than an official national total, and I would not quote it as one, but the order of magnitude is not in doubt. These are the technicians, line workers, millwrights, mechanics and field crews on whom the service life of a built asset actually depends.
The wage is the first thing an appraisal gets wrong
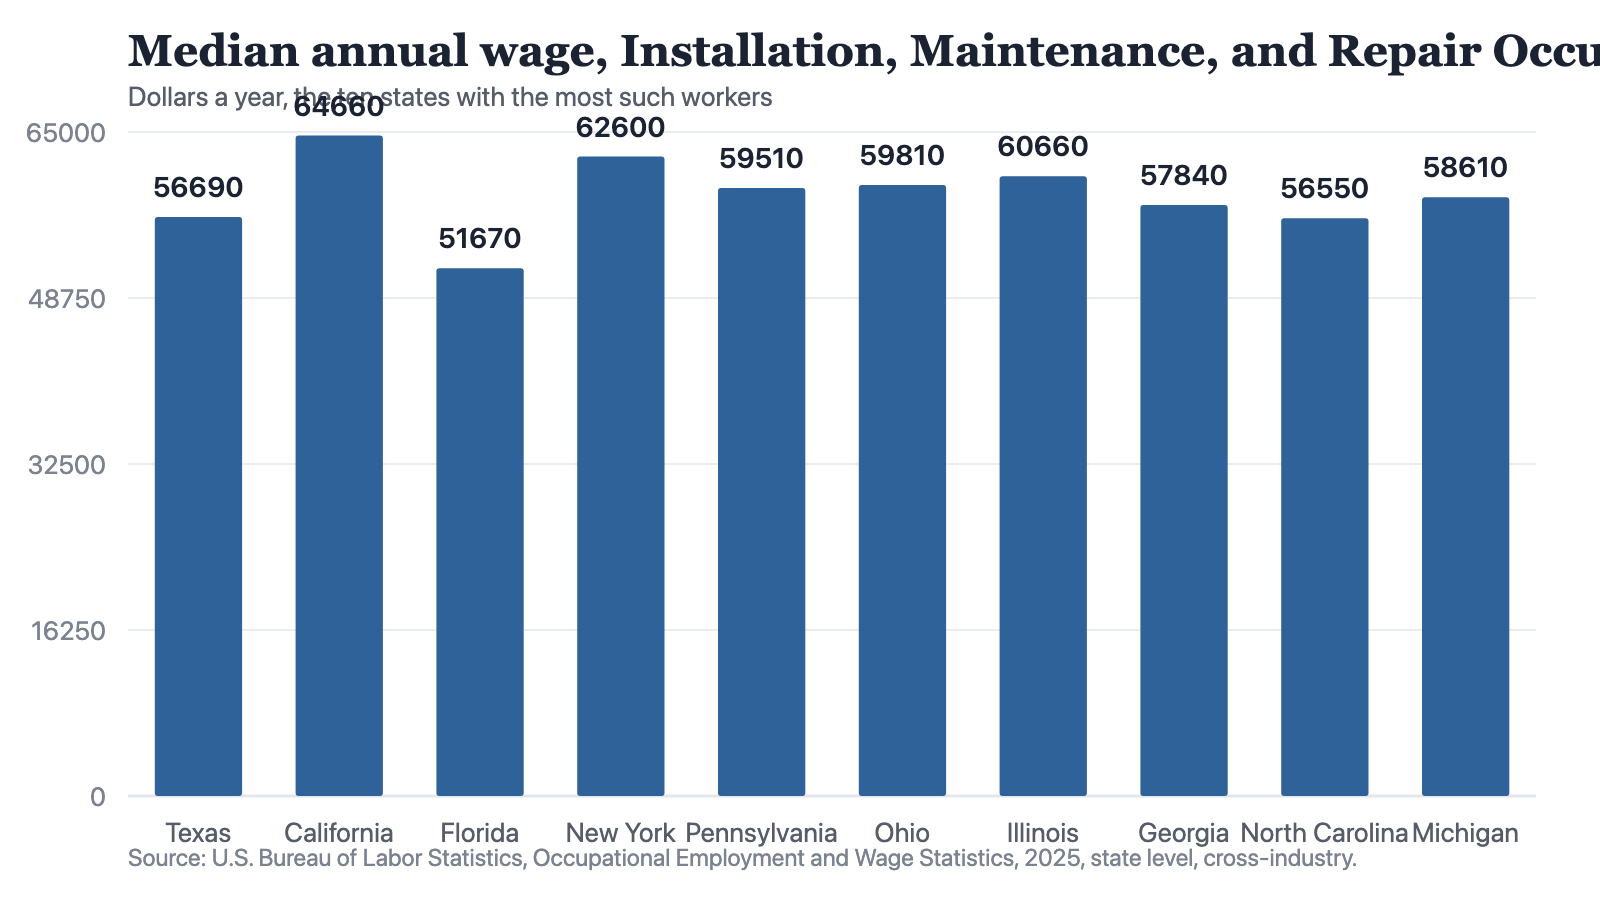
Notes: Annual medians for the whole major group, cross-industry. No estimate in this group is withheld and none is at the survey's upper wage bound.
Source: The Cefa Brief
Chart description
A bar chart of median annual wages for installation, maintenance and repair occupations in the ten states with the most such workers. California is highest at 64,660 dollars, followed by New York at 62,600, Illinois at 60,660, Ohio at 59,810, Pennsylvania at 59,510, Michigan at 58,610, Georgia at 57,840, Texas at 56,690, North Carolina at 56,550 and Florida lowest at 51,670. The range across these ten states is narrow.
A bar chart of median annual wages for installation, maintenance and repair occupations in the ten states with the most such workers. California is highest at 64,660 dollars, followed by New York at 62,600, Illinois at 60,660, Ohio at 59,810, Pennsylvania at 59,510, Michigan at 58,610, Georgia at 57,840, Texas at 56,690, North Carolina at 56,550 and Florida lowest at 51,670. The range across these ten states is narrow.
Take the three largest workforces. Texas employs 651,610 people in this group at a median of $56,690, against a state median across all occupations of $48,620. California employs 546,040 at $64,660 against $58,240. Florida employs 415,880 at $51,670 against $47,880. In each case the maintenance median sits above the general one, and in each case the gap is larger than a planner assuming a generic labour cost would allow for.
The pattern is close to universal. In 50 of the 51 jurisdictions this group's median wage exceeds the state's median wage across all occupations. The single exception is the District of Columbia, where the group earns $72,000 against a general median of $91,540, and that is a statement about the District's professional economy rather than about maintenance work.
What should unsettle anyone writing a site-selection memo is where the premium is widest. Mississippi's maintenance median is $49,130 against a state median of $40,120. Arkansas is $49,610 against $43,630. West Virginia is $49,740 against $45,300. Massachusetts, by contrast, pays this group $65,260 against a general median of $63,590. The low-wage states are the ones offering the smallest discount on precisely this labour, which means the cost advantage that makes a location attractive on paper largely evaporates for the workforce that has to stay after the contractors leave.
The low-wage states offer the smallest discount on precisely this labour.
And it is concentrated where the new build is going
Measured per thousand jobs, the most maintenance-heavy states are Wyoming at 61.8, Alaska at 59.2, Oklahoma at 53.9 and North Dakota at 53.0, with location quotients of 1.58, 1.51, 1.38 and 1.35. At the other end sit the District of Columbia at 15.3, Massachusetts at 29.4 and California at 30.0. Those four leaders are also four of the six states where severance tax is the largest share of state tax collections. The places whose public finances already rest on extraction are the places whose job bases already lean hardest on keeping equipment running.
A location quotient measures concentration, not scarcity, and I am not going to claim from it that anyone cannot hire. What it does establish is that a new asset in Wyoming or North Dakota will be recruiting into a pool that existing operators are recruiting from at the same time, in a labour market where this occupation already accounts for an unusually large share of all employment.
Two replies, and what should change
The first reply is that this is what markets are for: if a project needs technicians it can pay for them, and the wage figures above are evidence that the market already prices this work properly. That is fair as far as it goes. It is also an argument for putting the number in the appraisal rather than leaving it out, because a cost that will be paid is a cost that can be estimated, and the survey estimates it annually, free, state by state.
The second reply is that maintenance is an operating cost borne by an operator, and capital appraisal is not the place for it. I think that is where the reasoning goes wrong. The moment a structure promises availability, someone has taken staffing risk, and that risk is priced by whoever signed for it. If nobody has sized the pool the operator will be hiring from, the risk is being priced blind, and it is usually priced blind in the public sector's favour right up until the year it is not.
- Put the operating headcount and its wage next to the construction cost, using the published state figure for the relevant occupational group, and say which year it is from.
- Compare the occupation's wage against the state median rather than against the national one. The premium, not the level, is what a locating employer will actually feel.
- State the concentration. A project entering a state where this occupation is already 1.5 times as concentrated as the nation is making a different labour assumption from one entering a state at 0.8, and the appraisal should say which it is.
None of this requires new data collection. The figures exist, they are published every year at state level, and they cost nothing. They are simply not in the documents that decide where things get built, which tells you that the omission is a habit rather than a constraint. Habits are cheaper to change than assets are to retrofit, and an asset nobody can staff is the most expensive thing a programme can build.
About the author

Each author told us that for this piece they hold no interest a reader would think relevant.
This commentary carries its author's name because the view in it is the author's own. An editor reviewed it before publication, which is not the same as agreeing with it. It is not a position of the Center for Economics & Foreign Affairs or of Applied America.
© 2025. The author or authors hold the copyright in this commentary; CEFA publishes it with their permission. This edition, its editing and its presentation are © 2025 Center for Economics & Foreign Affairs. To republish it, see our republication terms. Republishing
Share
The Cefa Brief · applied.thecefa.org/cefa-brief/nobody-budgets-the-maintainers · Printed from the web edition