
Prime-age participation rose four years running, then held at 83.6 percent
The share of the 25 to 54 population in the labour force went from 81.4 percent in 2020 to 83.6 in 2024, a gain of 2.2 points, and 2025 came in at 83.6 again. The headline rate, which covers the civilian population rather than one age band, gained 0.7 points over the same six readings and fell in the final year.
by
Published 2 minute read

Illustration : The Cefa Brief
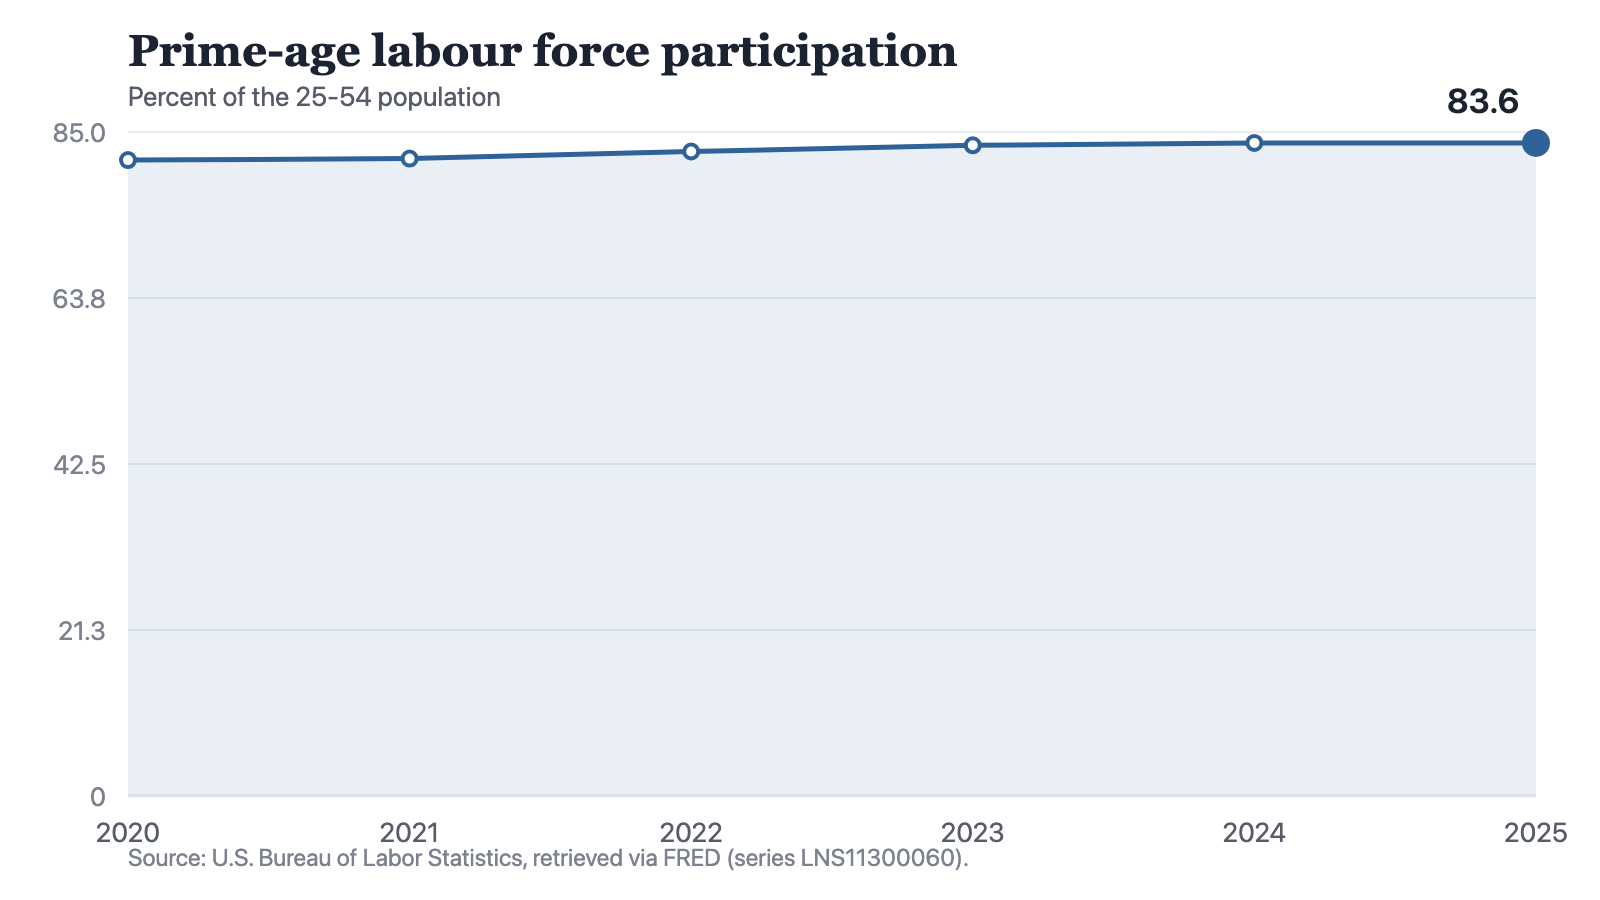
Prime-age labour force participation rose in four consecutive years and then stopped. The share of the 25 to 54 population in the labour force was 81.4 percent in 2020 and 83.6 percent in 2024, a gain of 2.2 points. The 2025 reading is 83.6 percent, the same figure as 2024, and the only reading in the window that is not higher than the one before it.
The six readings are 81.4 percent in 2020, 81.6 in 2021, 82.5 in 2022, 83.3 in 2023, 83.6 in 2024 and 83.6 in 2025.
Year on year the series added 0.2 points, then 0.9, then 0.8, then 0.3, then nothing. The last four of those steps fall in order. The two largest, 0.9 into 2022 and 0.8 into 2023, account for 1.7 of the 2.2 points gained across the window. The slowing was in the series for two steps before the flat reading arrived.
Notes: Annual observations. Each point is the annual observation as the source publishes it.
Source: The Cefa Brief
Chart description
A line chart of prime-age labour force participation as a percentage of the 25 to 54 population: 81.4 percent in 2020, 81.6 in 2021, 82.5 in 2022, 83.3 in 2023, 83.6 in 2024 and 83.6 in 2025. The line rises at each of the first four steps, by the most at the step into 2022, and is level between 2024 and 2025.
A line chart of prime-age labour force participation as a percentage of the 25 to 54 population: 81.4 percent in 2020, 81.6 in 2021, 82.5 in 2022, 83.3 in 2023, 83.6 in 2024 and 83.6 in 2025. The line rises at each of the first four steps, by the most at the step into 2022, and is level between 2024 and 2025.
The headline rate over the same years
The headline participation rate, which covers the civilian population rather than a single age band, reads 61.7 percent in 2020, 61.7 in 2021, 62.2 in 2022, 62.6 in 2023, 62.6 in 2024 and 62.4 in 2025. It gained 0.7 points across the window against the prime-age series' 2.2, a difference of 1.5 points, and its final step is a fall of 0.2 points rather than a flat reading.
That difference is not a measurement of anything. Restricting a rate to ages 25 to 54 excludes the ages at which retirement is common, but it does not adjust for the composition of the band itself, and nothing here decomposes either series into demography and behaviour. The gap between 2.2 points and 0.7 should not be read as the size of the ageing effect.
What the rate does not count
Two limits sit in the unit itself. The figure is a percentage of the 25 to 54 population, so it moves when that population changes as well as when the labour force does, and a rise in the share is not the same as a rise in the number of people working or looking. And participation counts attachment only. Someone counted here may be working part-time, working below their qualification, or looking without finding anything. The series does not distinguish those cases from full-time work.
What the series leaves out matters as much as what it holds. It says nothing about anyone under 25 or over 54, so it is silent on how young people are entering work and on how long older workers stay in it. It is a national figure and carries no geography. And it records the level of attachment without recording a cause: no part of this series says why the share rose between 2021 and 2024, or why it did not rise in 2025.
One flat reading is one flat reading. If the next annual observation comes in above 83.6 percent, the flat year reads as a pause in the four-year climb. If it comes in below, 83.6 becomes a ceiling, and the question turns to what the band ran into. Either reading needs an observation this series does not yet hold. The defensible sentence today is that the prime-age share gained 2.2 points, that all but 0.5 of that gain landed in 2022 and 2023, and that the gain has stopped.
Method and data
The figures are annual observations of labour force participation for the 25 to 54 age group, series LNS11300060, published by the U.S. Bureau of Labor Statistics, redistributed by FRED and retrieved for this site on 19 September 2026. Each annual point is the average of that year's monthly readings rather than a year-end figure or an annual total. The unit is a percentage of the 25 to 54 population, so each point is a share and not a count of people: the figure can move because the labour force changed, because that population changed, or both, and nothing here separates the two. Participation counts people working or looking for work and records nothing about hours, pay, or whether the work matches the worker. The series covers no one under 25 or over 54, carries no geography below the national level, and states no reason for any movement in it. The headline participation rate quoted in the text, series CIVPART, is a separate series covering the civilian population; it is named for contrast, no figure here is produced by combining the two, and the difference between their changes across the window is not a measurement of the effect of ageing.
How to cite
Jag DeSaint, "Prime-age participation rose four years running, then held at 83.6 percent," The Cefa Brief, Applied America, 28 mai 2026, https://applied.thecefa.org/cefa-brief/what-the-narrower-age-band-shows.
About the author

Each author told us that for this piece they hold no interest a reader would think relevant.
This Insights piece carries its author's name because the view in it is the author's own. An editor reviewed it before publication, which is not the same as agreeing with it. It is not a position of the Center for Economics & Foreign Affairs or of Applied America.
© 2026. The author or authors hold the copyright in this Insights piece; CEFA publishes it with their permission. This edition, its editing and its presentation are © 2026 Center for Economics & Foreign Affairs. To republish it, see our republication terms. Republishing
Share
The Cefa Brief · applied.thecefa.org/cefa-brief/what-the-narrower-age-band-shows · Printed from the web edition