
The largest fall in job openings came in the year unemployment was lowest
Openings peaked at 11.2 million on the monthly average in 2022 and have fallen in each of the three years since, by 1.9 million, then 1.6 million, then 0.6 million. The largest of those falls landed in 2023, when the unemployment rate read 3.6 percent, the lowest of its six readings, and the smallest landed in 2025, when the rate read 4.3 percent.
by
Published 3 minute read

Illustration : The Cefa Brief
Job openings across the whole economy reached 11.2 million on the monthly average in 2022. They have fallen in every year since, to 9.3 million in 2023, 7.7 million in 2024 and 7.1 million in 2025. The three falls are 1.9 million, 1.6 million and 0.6 million. They arrive in descending order of size, and it is the first of them that carries the finding.
The six readings are 6.3 million openings on the monthly average in 2020, 10 million in 2021, 11.2 million in 2022, 9.3 million in 2023, 7.7 million in 2024 and 7.1 million in 2025. The climb took two years and added 4.9 million. The descent has taken three and removed 4.1 million. Of the five year-on-year moves in the series, the most recent is the smallest.
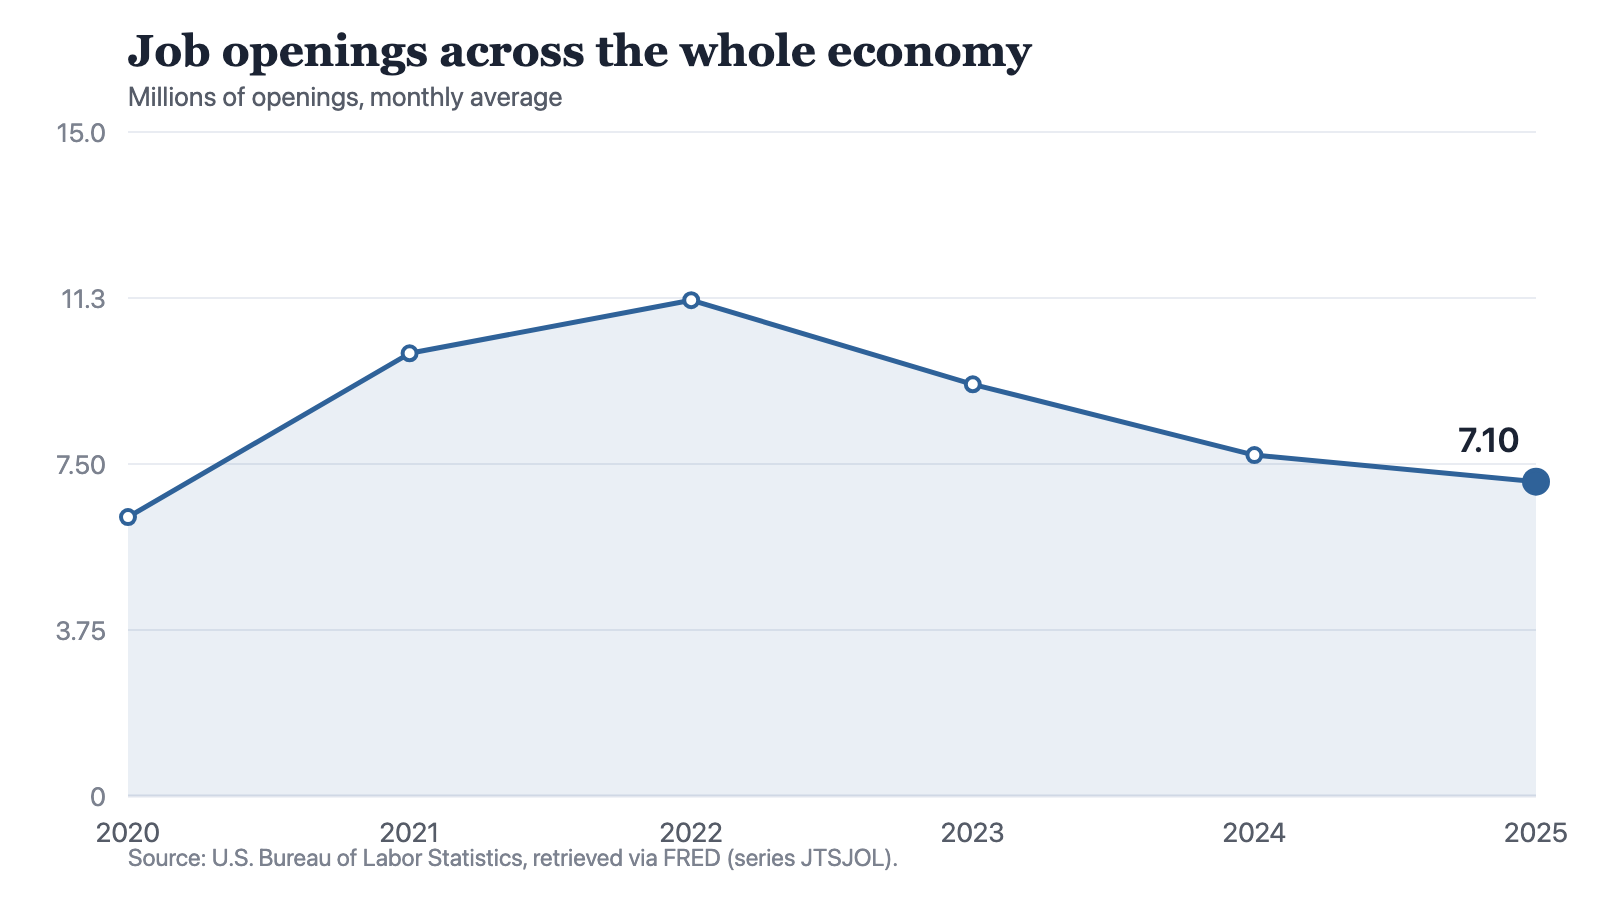
Notes: Annual observations. Each point is the average of that year's monthly readings, not the year's total of vacancies.
Source: The Cefa Brief
Chart description
A line chart of job openings across the whole economy, in millions of openings on the monthly average: 6.3 in 2020, 10 in 2021, 11.2 in 2022, 9.3 in 2023, 7.7 in 2024 and 7.1 in 2025. The line rises steeply for two years to its highest point at 11.2, then falls in each of the next three years, most steeply between 2022 and 2023 and least between 2024 and 2025.
A line chart of job openings across the whole economy, in millions of openings on the monthly average: 6.3 in 2020, 10 in 2021, 11.2 in 2022, 9.3 in 2023, 7.7 in 2024 and 7.1 in 2025. The line rises steeply for two years to its highest point at 11.2, then falls in each of the next three years, most steeply between 2022 and 2023 and least between 2024 and 2025.
The rate moved the other way
The unemployment rate, a separate series from the same agency, reads 8.1 percent of the labour force in 2020, 5.4 in 2021, 3.7 in 2022, 3.6 in 2023, 4 in 2024 and 4.3 in 2025. Its lowest reading of the six is the 3.6 percent recorded in 2023. That is the same year in which openings fell by 1.9 million, the largest single-year fall in the vacancy series. In the two years after it, openings fell by 1.6 million and then by 0.6 million, while the rate rose by 0.4 of a percentage point and then by 0.3.
Set out in that order the sequence reads plainly. Vacancies came down hardest in the year the rate sat at its floor, and came down least in the year the rate reached 4.3 percent, which no reading after 2021 exceeds. Neither series explains the other. They are stated in different units, one a count of openings and one a percent of the labour force, and nothing on this page divides one by the other.
A reader may expect the next figure to be vacancies per unemployed person. It is not here, because these two series cannot build it. That ratio needs a count of people out of work, which is a level, and this file holds a rate. I have not estimated the missing count, and anyone who wants the ratio should take it from the two underlying counts rather than from this piece.
A falling vacancy count and a falling unemployment rate can arrive in the same year. In this window they did, in 2023.
What a monthly average is
The unit here is millions of openings on the monthly average. Each point is the average of that year's twelve monthly readings, not the year's total of vacancies posted. Read 7.1 million as a year's worth of openings and the error is roughly a factor of twelve. The series does not publish a year's worth in any case, and the two quantities are not the same thing.
Six annual points is the whole of what this file holds. The peak can be dated no more finely than to 2022. The most recent move, 0.6 million, is the smallest of the five and the one least worth leaning on, since a single year's average can narrow for reasons that have nothing to do with a turn. What survives is the position of the three falls relative to each other and relative to the rate.
What would change the answer
A 2026 reading at or above 7.1 million would make 2025 a floor rather than a stage in a descent, and the finding would become a three-year fall that has ended. A reading below 6.3 million would put openings under their 2020 level for the first time in this window; they stand 0.8 million above it now. Whichever comes, the line to read beside it is the unemployment rate. The years in which the two moved together and the years in which they moved apart are what this pair of series shows, and the level of either one on its own shows less.
Method and data
The figures are annual observations of job openings across the whole economy, series JTSJOL, published by the U.S. Bureau of Labor Statistics, redistributed by FRED and retrieved for this site on 19 September 2026. The unit is millions of openings on the monthly average, so each point is the average of that year's monthly readings and not the year's total of vacancies; reading 7.1 million as a year's worth of openings would be wrong by roughly a factor of twelve. The series counts openings. It does not count hires, it does not say how long any opening stood or what it paid, and it does not say which industries or which states the openings sit in. The unemployment rate quoted for contrast, series UNRATE, is a percent of the labour force and is named here for context only. The two series are not combined, and no vacancies-per-unemployed-person figure appears on this page, because that ratio needs a count of unemployed people and neither series holds one. Both series carry six annual points and no monthly detail, so the month of the peak, within-year turning points and any seasonality sit outside what this piece can state.
How to cite
Jag DeSaint, "The largest fall in job openings came in the year unemployment was lowest," The Cefa Brief, Applied America, 17 février 2026, https://applied.thecefa.org/cefa-brief/the-order-the-falls-arrived-in.
About the author

Each author told us that for this piece they hold no interest a reader would think relevant.
This Insights piece carries its author's name because the view in it is the author's own. An editor reviewed it before publication, which is not the same as agreeing with it. It is not a position of the Center for Economics & Foreign Affairs or of Applied America.
© 2026. The author or authors hold the copyright in this Insights piece; CEFA publishes it with their permission. This edition, its editing and its presentation are © 2026 Center for Economics & Foreign Affairs. To republish it, see our republication terms. Republishing
Share
The Cefa Brief · applied.thecefa.org/cefa-brief/the-order-the-falls-arrived-in · Printed from the web edition