
The states most crowded with construction workers are mostly drilling and mining
Ranked by construction and extraction jobs per thousand, the top of the table is Wyoming, North Dakota, New Mexico and Alaska. Their own occupational detail shows what is doing the work in that ranking, and it is not building.
by
Published 3 minute read

Illustration : The Cefa Brief
There is a chart that gets made whenever someone asks where America has the capacity to build. It ranks the states by construction employment per head of the workforce, and it puts Wyoming on top. Wyoming has 25,520 people in the occupational group, against 674,000 in Texas. It leads because those 25,520 are a large share of a small job base: 90.897 jobs per thousand, and a location quotient of 2.2, meaning the state is 2.2 times as concentrated in this work as the country is.
The problem is not the arithmetic. It is the label. The federal occupational group is called Construction and Extraction Occupations, and the second word is carrying more weight in that top ten than the first.
What the top of the ranking is made of
The same file that produces the ranking also records, for each state, the detailed occupations in which that state is most concentrated. Read those lists for the leaders and the picture resolves immediately. Wyoming's single most concentrated occupation is Roustabouts, Oil and Gas, with a location quotient of 14.56. North Dakota's leading extraction trade is Service Unit Operators, Oil and Gas at 25.16, with Roustabouts close behind at 19.77. New Mexico shows Service Unit Operators at 10.75 and Roustabouts at 8.82. West Virginia's most concentrated occupation of any kind is Loading and Moving Machine Operators, Underground Mining, at 46.62. Louisiana's is Extraction Workers, All Other, at 23.94.
Every one of those occupations sits inside the 47-0000 group. None of them builds anything. A state that ranks high on this measure because of roustabouts and underground machine operators has told you about its resource base, not about its ability to put up a plant.
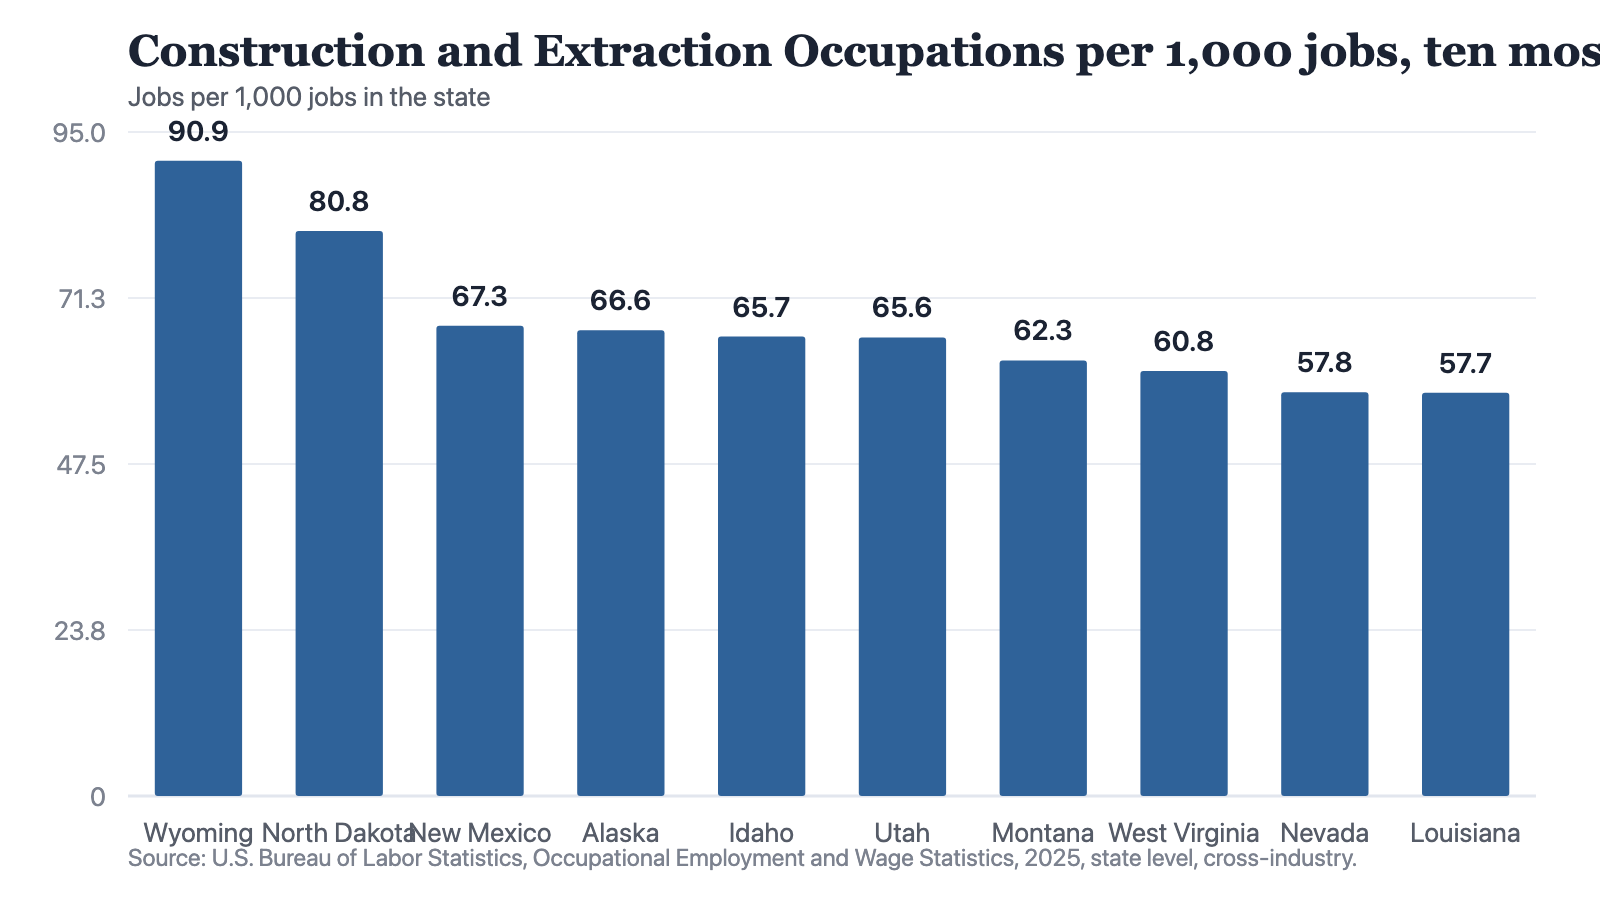
Notes: Source: U.S. Bureau of Labor Statistics, Occupational Employment and Wage Statistics, 2025, state level, cross-industry. All 51 jurisdictions carry a value for this group.
Source: The Cefa Brief
Chart description
Ten bars, longest first. Wyoming leads at 90.897 jobs per 1,000, followed by North Dakota at 80.848, New Mexico at 67.283, Alaska at 66.622, Idaho at 65.721, Utah at 65.616, Montana at 62.329, West Virginia at 60.82, Nevada at 57.758 and Louisiana at 57.681. Wyoming's figure is roughly five times the lowest in the country, the District of Columbia at 18.192.
Ten bars, longest first. Wyoming leads at 90.897 jobs per 1,000, followed by North Dakota at 80.848, New Mexico at 67.283, Alaska at 66.622, Idaho at 65.721, Utah at 65.616, Montana at 62.329, West Virginia at 60.82, Nevada at 57.758 and Louisiana at 57.681. Wyoming's figure is roughly five times the lowest in the country, the District of Columbia at 18.192.
Where the same ranking does mean building
Two states in that top ten pass the test. Idaho's concentration list is led by Forest and Conservation Technicians, but it then runs through Carpenters at 2.27 and Cement Masons and Concrete Finishers at 2.23. Utah's includes Tile and Stone Setters at 3.96. Those are building trades, and their presence changes what the headline number means for that state entirely.
Several of the extraction states carry a genuine equipment trade as well. Operating Engineers and Other Construction Equipment Operators appears at 4.4 in Wyoming, 3.7 in North Dakota and 3.63 in West Virginia, and North Dakota also shows Highway Maintenance Workers at 2.91. Heavy civil capability and oilfield capability overlap in the same machines and often the same people. That is a real finding, and it is not the same as saying these states are equipped to build a factory.
The occupational group is a unit of statistical convenience. It is not a unit of industrial capability, and it will not survive being used as one.
The bottom of the table, and the wage inversion
The other end is just as instructive. The District of Columbia sits last at 18.192 per thousand, which says almost nothing except that a city is being counted as a state. Above it come New Jersey at 29.464, Connecticut at 30.183, Illinois at 30.696, Georgia at 31.799 and New York at 33.024. These are not states without construction. New York alone employs 319,930 people in the group and Illinois 187,190. They rank low because their job bases are large and diversified.
Then the wages invert the story. Illinois pays a median of 80,570 dollars in this occupational group while ranking forty-eighth of fifty-one on concentration. Hawaii pays 82,440, the highest of any state. Massachusetts pays 77,480 and Washington 75,500. Texas, which employs the most such workers in the country at 674,000, pays 49,170. Florida, second on employment at 462,050, pays 49,370. Arkansas, at 45,870, is the lowest in the country. The states with the deepest pools of this labour are, with few exceptions, the states where it is cheapest.
Two of those leaders are worth holding side by side. Texas at 674,000 and California at 672,770 employ almost identical numbers of construction and extraction workers. Their concentrations are not close at all — 47.9 per thousand against 36.937 — and their medians are 49,170 and 71,670. Anyone using a single state-level construction measure to compare those two labour markets is choosing, without saying so, which of three very different answers they want.
None of this means the per-thousand ranking should be thrown away. It means it should be read with the state's own occupational detail beside it, which takes about a minute and is in the same file. The national construction task has grown — value put in place rose from 1.65 trillion dollars in 2021 to 2.24 trillion in 2024 and held there in 2025 — and the question of which states can absorb more of it is a serious one. It is just not answered by a ranking whose top entry is explained by roustabouts.
Method and data
The occupational figures are the Bureau of Labor Statistics Occupational Employment and Wage Statistics for 2025, at state level, cross-industry, as held on this site. All 51 jurisdictions carry a value for the major group Construction and Extraction Occupations, code 47-0000, and none of the wage figures in that group is withheld or capped.
Jobs per 1,000 is the file's own per1000 field: the occupation group's employment divided by total employment in that state, expressed per thousand. The location quotient is the file's own lq field, defined there as the occupation's share of that state's jobs divided by its share of national jobs, so a value above 1 means the state is more concentrated in that work than the nation is.
The detailed occupations quoted are drawn from each state's speciality list, which the file limits to occupations employing at least 1,000 people in that state and ranks by location quotient. That list is not a census of a state's construction trades; it is the occupations in which the state is most concentrated. An occupation absent from it is not absent from the state.
Construction value put in place is the series TTLCONS from the U.S. Census Bureau, retrieved via FRED on 19 September 2026, in current dollars. It is a national series and is used here only as national context. There is no state construction spending series on this site, so nothing in this piece connects a state's workforce to a state's construction volume.
The occupational file is a single year. It carries no prior period, so no state's figure here can be compared with its own past.
How to cite
Jag DeSaint, "The states most crowded with construction workers are mostly drilling and mining," The Cefa Brief, Applied America, 3 décembre 2025, https://applied.thecefa.org/cefa-brief/construction-and-extraction-is-two-workforces.
About the author

Each author told us that for this piece they hold no interest a reader would think relevant.
This Insights piece carries its author's name because the view in it is the author's own. An editor reviewed it before publication, which is not the same as agreeing with it. It is not a position of the Center for Economics & Foreign Affairs or of Applied America.
© 2025. The author or authors hold the copyright in this Insights piece; CEFA publishes it with their permission. This edition, its editing and its presentation are © 2025 Center for Economics & Foreign Affairs. To republish it, see our republication terms. Republishing
Share
The Cefa Brief · applied.thecefa.org/cefa-brief/construction-and-extraction-is-two-workforces · Printed from the web edition