
Housing units authorised by permit fell in every year after 2021 and are now below their 2020 reading
The series peaked at a monthly average of 1734 thousand units in 2021 and has come down in each of the four years since, to 1431 in 2025. The thirty-year mortgage rate reached its own high in 2023 and has eased in the two years since, and authorisations fell in both of them.
by
Published Corrected 3 minute read

Illustration : The Cefa Brief
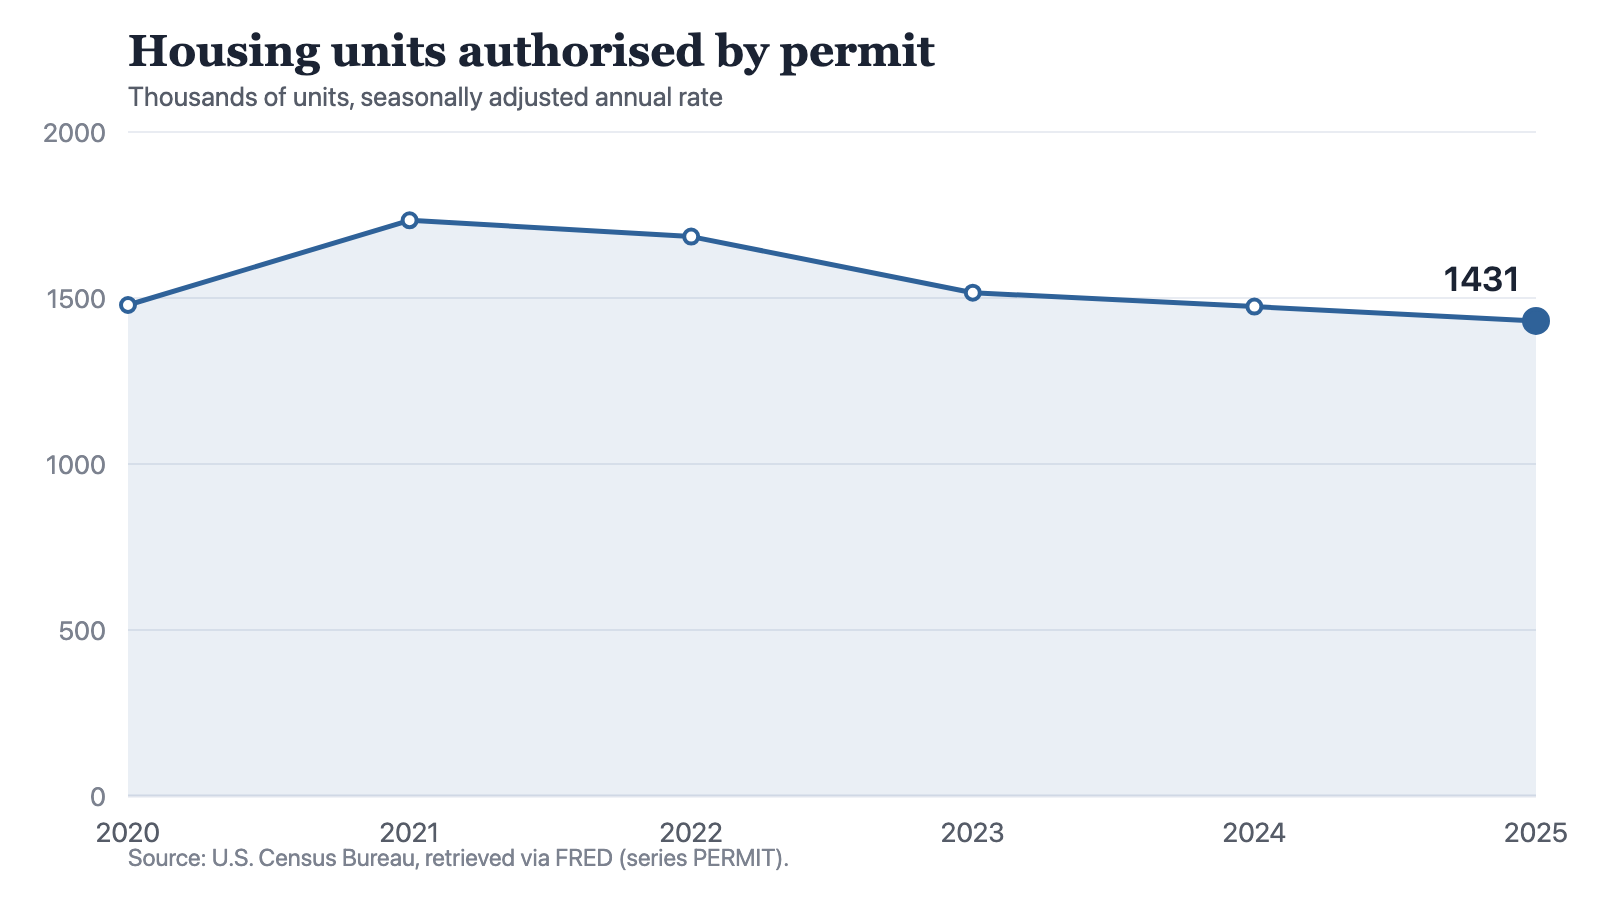
Housing units authorised by permit have fallen in every year since 2021. The annual rate was 1479 thousand units in 2020, rose to 1734 in 2021, and has come down at every step since, to 1431 in 2025. That is the lowest of the six readings, and it is 48 below the 2020 figure, or 3.2 per cent lower. Four years of decline have taken the series past its starting point.
The six readings are 1479 in 2020, 1734 in 2021, 1685 in 2022, 1516 in 2023, 1474 in 2024 and 1431 in 2025, all in thousands of units at a seasonally adjusted annual rate. The steps are one rise of 255, then falls of 49, 169, 42 and 43. From the 2021 peak to 2025 the series is down 303, just under 17.5 per cent of the 2021 figure. The two most recent falls together come to 85, which is just over half the single fall into 2023.
Notes: Annual observations. Each monthly reading is already stated at a yearly rate, so each point approximates the year’s own figure rather than one month’s.
Source: The Cefa Brief
Chart description
A line chart of housing units authorised by permit, in thousands of units at a seasonally adjusted annual rate: 1479 in 2020, 1734 in 2021, 1685 in 2022, 1516 in 2023, 1474 in 2024 and 1431 in 2025. The line rises once, into 2021, then falls at every step after it. The steepest fall is between 2022 and 2023, and the last point sits below the first.
A line chart of housing units authorised by permit, in thousands of units at a seasonally adjusted annual rate: 1479 in 2020, 1734 in 2021, 1685 in 2022, 1516 in 2023, 1474 in 2024 and 1431 in 2025. The line rises once, into 2021, then falls at every step after it. The steepest fall is between 2022 and 2023, and the last point sits below the first.
The rate stopped rising and the line did not
The thirty-year fixed mortgage rate runs 3.11, 2.96, 5.34, 6.81, 6.72 and 6.6 per cent across the same six years. Its high is 6.81 per cent in 2023, the same year that holds the largest single-year fall in authorisations, 169. Since that high the rate has eased by 0.21 percentage points over two years. Authorisations fell by 85 over the same two years, from 1516 to 1431.
The two series do not move step for step. The largest single-year rise in the rate, 2.38 percentage points into 2022, came with a fall of 49 in authorisations. The smaller rise that followed, 1.47 points into 2023, came with the largest fall of the window, 169. Nothing here divides one series by the other, and the ordering of the steps is the point: whatever is pulling authorisations down did not stop when the rate did.
What an authorisation is not
Two things about the measure. It counts authorisation, not construction: a permit that is never used is in the figure, and a house finished this year under a permit issued three years ago is not. And the unit is a seasonally adjusted annual rate, so 1431 is a yearly rate, roughly the number of units authorised across 2025, rather than a single month's count.
The series also holds only a national figure. It carries no split between single-family and multifamily units, and no geography below the country as a whole. A national figure that falls 43 in a year is consistent with many local markets falling and some rising. This series cannot say which, and it cannot say whether the fall is demand withdrawing, financing costs, or the rules under which permits are granted.
What would change the answer is a rise, and a rise larger than the steps the series has been taking. The last two moves were 42 and 43 in the opposite direction. A single annual figure above 1431 would end the run of declines, and one above 1479 would put the series back above where this window began. A return to the 2021 figure of 1734 would require a gain of 303, larger than any single move in this window. Until one of those appears, the plainest sentence available is that authorisations have been falling for four years and are now lower than they were in 2020.
Updates and corrections
Correction ·
Corrected 19 September 2026. An earlier version of this piece described permit authorisations as a monthly average. The Census Bureau publishes this series at a seasonally adjusted annual rate, so each figure states units authorised at a yearly rate rather than in a single month. Every figure and comparison in the piece is unchanged; what was wrong was the description of what the figures measure. The chart has been redrawn with the corrected unit.
Correction ·
Corrected 19 September 2026. An earlier version added that reading a figure as a single month's would understate it by roughly a factor of twelve. That had the relationship the wrong way round: the figure is already stated at a yearly rate, so reading it as one month's overstates that month. The sentence has been removed rather than reversed, because the method note already says plainly that each point is a yearly rate and approximates the year. No figure in the piece has changed.
Method and data
The figures are annual observations of housing units authorised by building permits, series PERMIT, published by the U.S. Census Bureau, redistributed by FRED and retrieved for this site on 19 September 2026. The unit is thousands of units at a seasonally adjusted annual rate, which means each monthly reading is already stated as a yearly rate, so each annual point is itself a yearly rate and approximates the units authorised across that year; The series records authorisation, not construction, so a permit that is never used still counts, and a unit built under a permit issued in an earlier year does not. It carries no split between single-family and multifamily units, no geography below the national figure, and nothing about the size, price or tenure of what was authorised. The thirty-year fixed mortgage rate quoted in the text is a separate series from a separate source, named for context; nothing here divides one series by the other, and no part of the fall is attributed to the rate.
How to cite
Jag DeSaint, "Housing units authorised by permit fell in every year after 2021 and are now below their 2020 reading," The Cefa Brief, Applied America, 25 avril 2025, https://applied.thecefa.org/cefa-brief/the-rate-stopped-rising-permits-did-not. Updated 19 septembre 2026.
About the author

Each author told us that for this piece they hold no interest a reader would think relevant.
This Insights piece carries its author's name because the view in it is the author's own. An editor reviewed it before publication, which is not the same as agreeing with it. It is not a position of the Center for Economics & Foreign Affairs or of Applied America.
© 2025. The author or authors hold the copyright in this Insights piece; CEFA publishes it with their permission. This edition, its editing and its presentation are © 2025 Center for Economics & Foreign Affairs. To republish it, see our republication terms. Republishing
Share
The Cefa Brief · applied.thecefa.org/cefa-brief/the-rate-stopped-rising-permits-did-not · Printed from the web edition