
The consumer price index has not fallen in a single year since 2020
Prices rose more slowly after 2022, and the index kept rising anyway. It stands at 322 against 258.9 five years earlier, a level about 24 percent higher.
by
Published 3 minute read

Illustration : The Cefa Brief
The public argument about American prices has been conducted almost entirely in rates of change, and the rate of change has been improving for three years. The index itself has done something else. In six annual observations it has gone up every time.
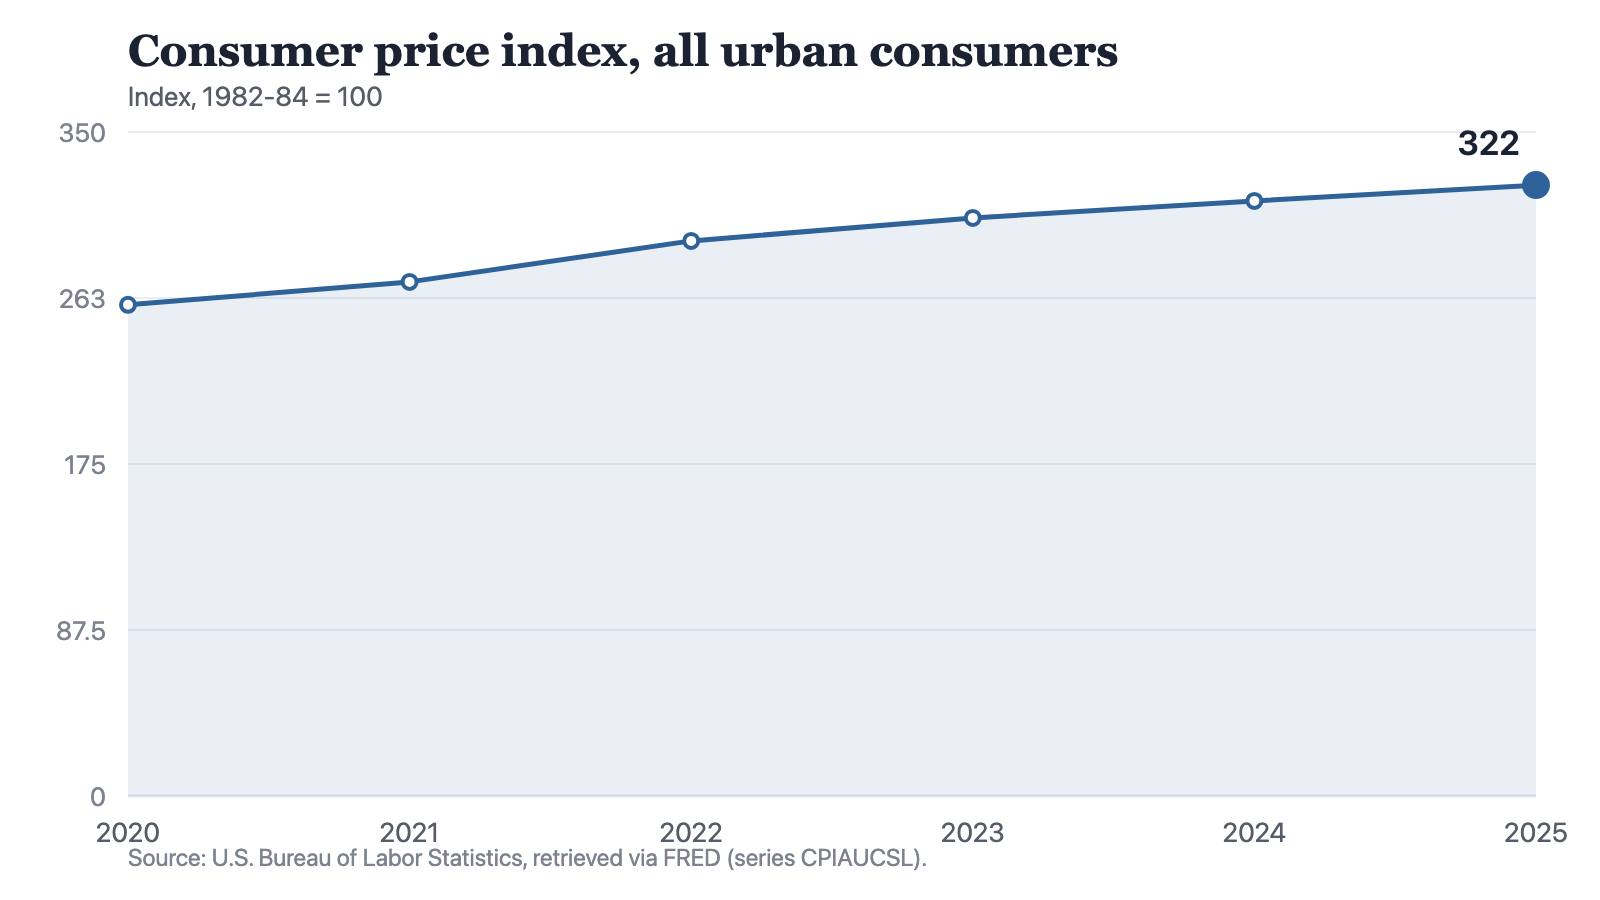
The readings are 258.9 in 2020, 271 in 2021, 292.6 in 2022, 304.7 in 2023, 313.7 in 2024 and 322 in 2025. There is no year in that sequence where the number is lower than the year before. The finding is not that inflation was high, which is well documented, but that nothing in the record since has reversed any part of the level it produced.
A rate that falls and a level that does not
This is the distinction that a rate of change quietly discards. Falling inflation means the index is climbing more gently. It does not mean the index is coming down. For the index to come down, prices in general would have to be lower than they were, which in this series has not happened once.
Notes: Annual observations. The index measures a basket priced for urban consumers as a group, and is not any single household's cost of living.
Source: The Cefa Brief
Chart description
A line chart of the consumer price index rising from 258.9 in 2020 to 271 in 2021, then steeply to 292.6 in 2022, then to 304.7 in 2023, 313.7 in 2024 and 322 in 2025. The slope is steepest between 2021 and 2022 and flattens across the last three observations, but the line never falls.
A line chart of the consumer price index rising from 258.9 in 2020 to 271 in 2021, then steeply to 292.6 in 2022, then to 304.7 in 2023, 313.7 in 2024 and 322 in 2025. The slope is steepest between 2021 and 2022 and flattens across the last three observations, but the line never falls.
The annual increases, in index points, run 12.1, then 21.6, then 12.1, then 9, then 8.3. Read that sequence and the disinflation is unmistakable: the steps after 2022 are smaller, and each of the last three is smaller than the one before it. Read the same sequence as a running total and the level is 63.1 points higher than where the window opened.
One detail in that list is worth pausing on. The rise from 2020 to 2021 and the rise from 2022 to 2023 are identical at 12.1 points. They are not identical as experiences, because the second one is measured from a base 33.7 points higher. The same number of points off a larger base is a smaller proportional move, which is exactly why a proportional measure showed improvement while the level continued to climb.
What the number 322 is
On its own, 322 means nothing. The index sits on a 1982-84 base of 100, a choice made by the statistical agency and not a fact about prices. The figure is only ever informative against another figure from the same series. Compared with 258.9 in 2020, the 2025 level is about 24 percent higher, and that ratio is the whole of what the two numbers jointly license.
It also measures a basket, priced for urban consumers as a group. A household whose spending is weighted differently from that basket, towards rent, or fuel, or childcare, has experienced something this index does not describe. The series is a national aggregate and does not resolve to anyone in particular.
And these are annual observations. They contain no information about turning points inside a year, no monthly detail, and no seasonality. Anyone wanting to know when in 2022 the steepest section occurred will not find it here, and should not infer it from the shape of a six-point line.
Why the level is the operative number
For an institution committing to a multi-year obligation, a wage agreement, a lease, an availability payment, a concession, the rate of inflation matters only as an input to a forecast. The level is what the obligation is denominated against. A contract written in 2020 dollars and paid in 2025 dollars is settled by the ratio between 258.9 and 322, whatever happened to the rate of change in between.
That is the practical content of a line that flattens without falling. The improvement in the rate is real and visible in the last three steps. It is also, in level terms, a decision to stop climbing quickly rather than a decision to come back down, and no observation in this series suggests the second thing is what happened.
Method and data
The figures are annual observations of the consumer price index for all urban consumers, published by the U.S. Bureau of Labor Statistics and redistributed by FRED, retrieved for this site on 19 September 2026. The index is stated on a 1982-84 base of 100.
The index is a price level, not an inflation rate. The point changes quoted here are differences between consecutive observations in the series. The statement that 2025 stands about 24 percent above 2020 is the ratio of the two published index values, 322 against 258.9, and carries no adjustment of any kind.
The index tracks a fixed basket priced for urban consumers as a group. It is not any particular household's cost of living, it is not broken down here by city, income or category, and these annual observations say nothing about the path of prices inside a year.
How to cite
Jag DeSaint, "The consumer price index has not fallen in a single year since 2020," The Cefa Brief, Applied America, 7 novembre 2025, https://applied.thecefa.org/cefa-brief/price-level-never-came-back-down.
About the author

Each author told us that for this piece they hold no interest a reader would think relevant.
This Insights piece carries its author's name because the view in it is the author's own. An editor reviewed it before publication, which is not the same as agreeing with it. It is not a position of the Center for Economics & Foreign Affairs or of Applied America.
© 2025. The author or authors hold the copyright in this Insights piece; CEFA publishes it with their permission. This edition, its editing and its presentation are © 2025 Center for Economics & Foreign Affairs. To republish it, see our republication terms. Republishing
Share
The Cefa Brief · applied.thecefa.org/cefa-brief/price-level-never-came-back-down · Printed from the web edition