
Manufacturing employment and manufacturing output measure different things
A country can make more while employing fewer people, and the federal series that track it will say so. This explains what each one counts and when each one is the right measure to cite.
Prepared by
Last reviewed Published 3 minute read

Illustration : The Cefa Brief
Two series are quoted as the state of American manufacturing, and they answer different questions. One counts people. The other counts things. The first comes from the Bureau of Labor Statistics, which asks employers how many workers were on the payroll in the pay period covering the twelfth of the month and adds up the establishments classified as manufacturing. The second comes from the Federal Reserve, which estimates how much those establishments physically produced and reports it as an index against a base year.
A payroll job is a job whether it runs forty hours or five, and a worker holding two of them is counted twice. The employment series is a headcount of positions, not of people and not of hours. Hours are published separately, and a plant that cuts overtime before it cuts staff shows up in the hours series first and in the headcount later, or not at all.
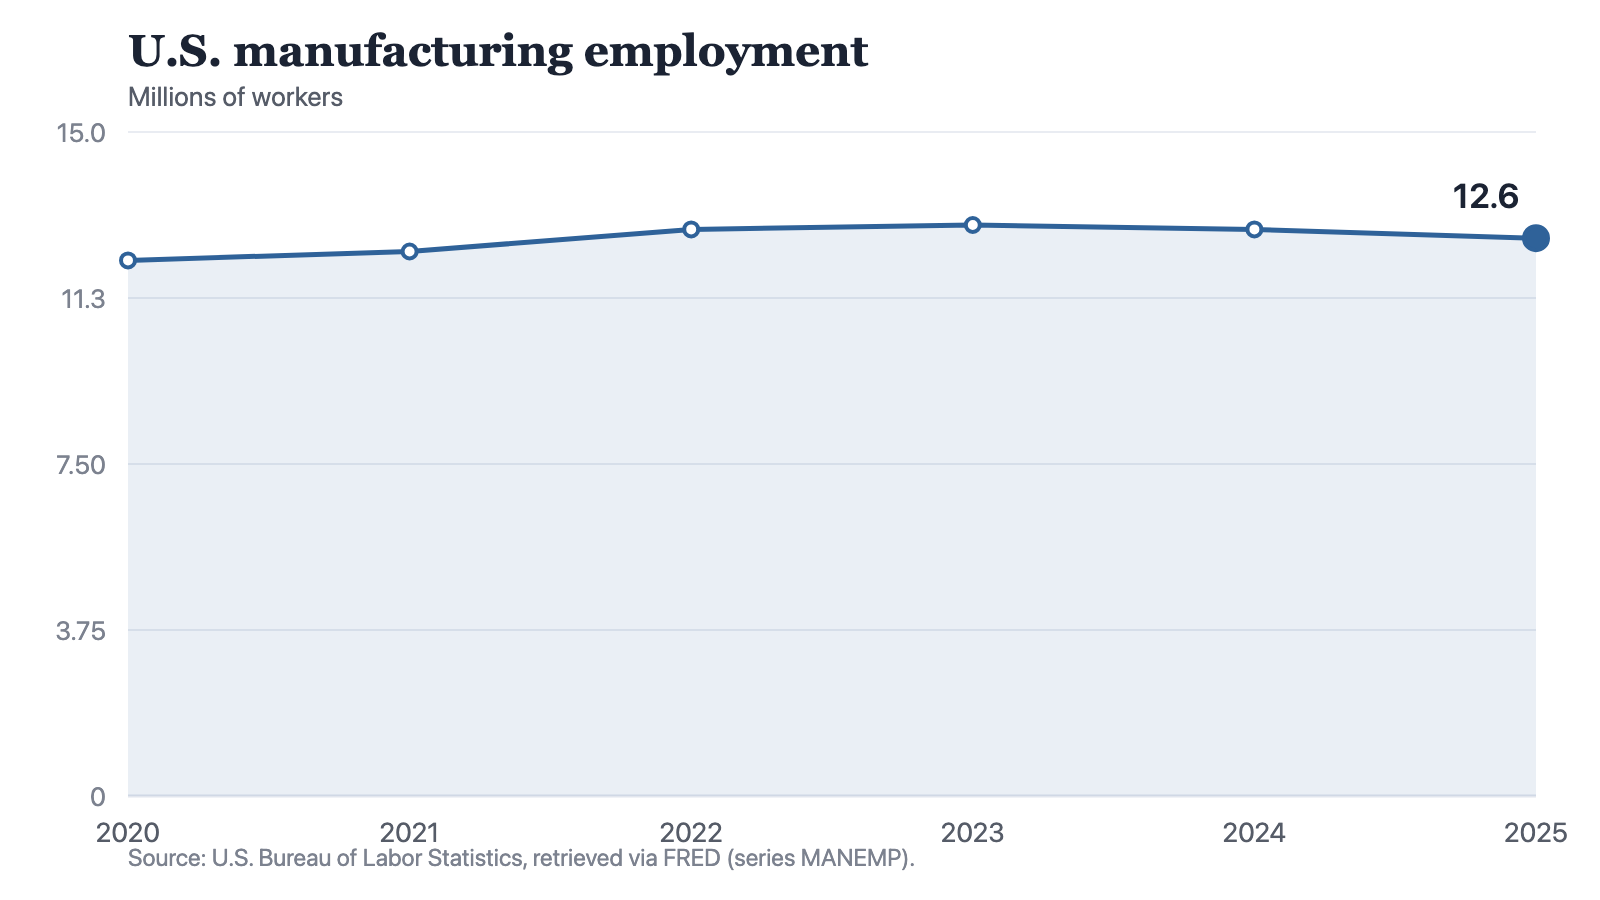
Notes: Source: U.S. Bureau of Labor Statistics, retrieved via FRED (series MANEMP). The count excludes the self-employed and says nothing about hours worked or output produced.
Source: The Cefa Brief
Chart description
A six-point line across the years 2020 to 2025. It begins at 12.1 million workers in 2020 and climbs for three steps, to 12.3 million in 2021, 12.8 million in 2022 and 12.9 million in 2023, with the steepest single step between 2021 and 2022. The line then turns and falls in each of the last two steps, to 12.8 million in 2024 and 12.6 million in 2025. The overall shape is a shallow arch. The 2025 endpoint sits above where the line started in 2020 and below its 2023 high.
A six-point line across the years 2020 to 2025. It begins at 12.1 million workers in 2020 and climbs for three steps, to 12.3 million in 2021, 12.8 million in 2022 and 12.9 million in 2023, with the steepest single step between 2021 and 2022. The line then turns and falls in each of the last two steps, to 12.8 million in 2024 and 12.6 million in 2025. The overall shape is a shallow arch. The 2025 endpoint sits above where the line started in 2020 and below its 2023 high.
Why the two series can move apart
Output per worker is the hinge. A plant that installs a press line, a furnace or a cell of robots can make more with the same crew, or the same with a smaller one. Nothing has left the country and no order has been lost, and the headcount still falls. This is the ordinary arithmetic of capital deepening, and in a capital-intensive industry it can run for years without a single plant closing.
Semiconductors show the pattern inside one industry. The Federal Reserve's industrial production index for semiconductors, set at 100 in 2017, stood at 121 in 2021 and 165 in 2025. That is a quantity index for one part of manufacturing, not the sector as a whole, and it carries no information at all about who was employed to produce the quantity. Read beside a headcount, it makes the point that these are two separate questions: how much is being made, and how many people are making it.
The classification boundary moves as well
An establishment is classified by what it principally makes, and the classification belongs to the establishment rather than to the worker. Three ordinary corporate decisions take a job out of the manufacturing count without changing anything that comes off the line.
- The plant contracts out cleaning, catering, security or logistics. The same people do the same work in the same building, now employed by a services firm and counted in services.
- The plant hires through a staffing agency. The agency is classified in administrative services, so those workers sit outside the manufacturing count for as long as they are on the agency's books.
- A firm reorganises so that design, software or distribution sits in its own establishment, which is then classified by that activity rather than by the factory next door.
What each measure is good for
For a question about livelihoods, meaning how many people draw a manufacturing wage in a county and whether that number is rising, the employment series is the right one. It is published monthly, by state and by metropolitan area, and nothing else has that reach. For a question about capacity, meaning whether a country can make what it needs and how much of it, production and value-added measures are the right ones, and no headcount substitutes for them. A programme judged on jobs created and a programme judged on domestic capacity are not the same programme, and the choice of series often settles the verdict before any evidence is weighed.
A headcount answers how many people are making things. It does not answer how much is being made.
So when a claim is made about manufacturing, find the noun it rests on. Jobs, payrolls and employment point to the establishment survey and a count of positions. Output, production, capacity and value added point to a quantity measure. If a claim slides from one to the other, offering a rise in output as evidence about jobs or a fall in jobs as evidence about capacity, the series being cited is not the series being argued about.
About the author
Each author told us that for this piece they hold no interest a reader would think relevant.
Explainers are written and kept up to date by The Cefa Brief’s editors. An Explainer is background CEFA stands behind. It is not one author’s argument, and it is not a CEFA position on what anyone should do. If something here is wrong or out of date, write to applied@thecefa.org.
© 2026 Center for Economics & Foreign Affairs. To republish it, see our republication terms. Republishing
Share
The Cefa Brief · applied.thecefa.org/cefa-brief/manufacturing-jobs-versus-output · Printed from the web edition