
Adaptation keeps losing to mitigation because an avoided loss is not a cash flow
The ten-year Treasury averaged 0.89 percent in 2020 and 4.29 percent in 2025, and at those rates a dollar of avoided damage arriving in thirty years is worth 76.7 cents and 28.4 cents. Turning that dollar into a cash flow needs a named obligor, and the party that funds a defence is rarely the party whose balance sheet it repairs.
by
Published 6 minute read

Illustration : The Cefa Brief
Adaptation finance lags mitigation finance because appraisal is a test that mitigation can pass and adaptation cannot, and more capital will not change that until the test changes. That is my position. A mitigation project ends in something a financier can be repaid out of: power sold, fuel not bought, a credit issued against a measured reduction. An adaptation project ends in a loss that did not occur. Nobody invoices for a flood that did not arrive.
The gap between the two is not a gap in urgency and it is not a gap in evidence. Appraisal turns a project into a schedule of dated cash flows and discounts them. Mitigation reaches that stage with a revenue line already written. Adaptation reaches it with an argument, and an argument occupies no row in the model.
The discount rate decides it
Start with the number that does the deciding. The ten-year Treasury constant maturity rate, in percent, runs 0.89 in 2020, 1.45 in 2021, 2.95 in 2022, 3.96 in 2023, 4.21 in 2024 and 4.29 in 2025. Each point is that year's average. The window opens at 0.89 and closes at 4.29, a rise of 3.40 points, and the series does not fall in any year of it.
Run that rate through the arithmetic every appraisal performs. One dollar received in thirty years, discounted at a constant rate, is one divided by one plus the rate, raised to the thirtieth power. At the 2020 rate of 0.89 percent that dollar is worth 76.7 cents today. At the 2025 rate of 4.29 percent it is worth 28.4 cents. The 2020 value is 2.70 times the 2025 value. Nothing about the flood changed in between.
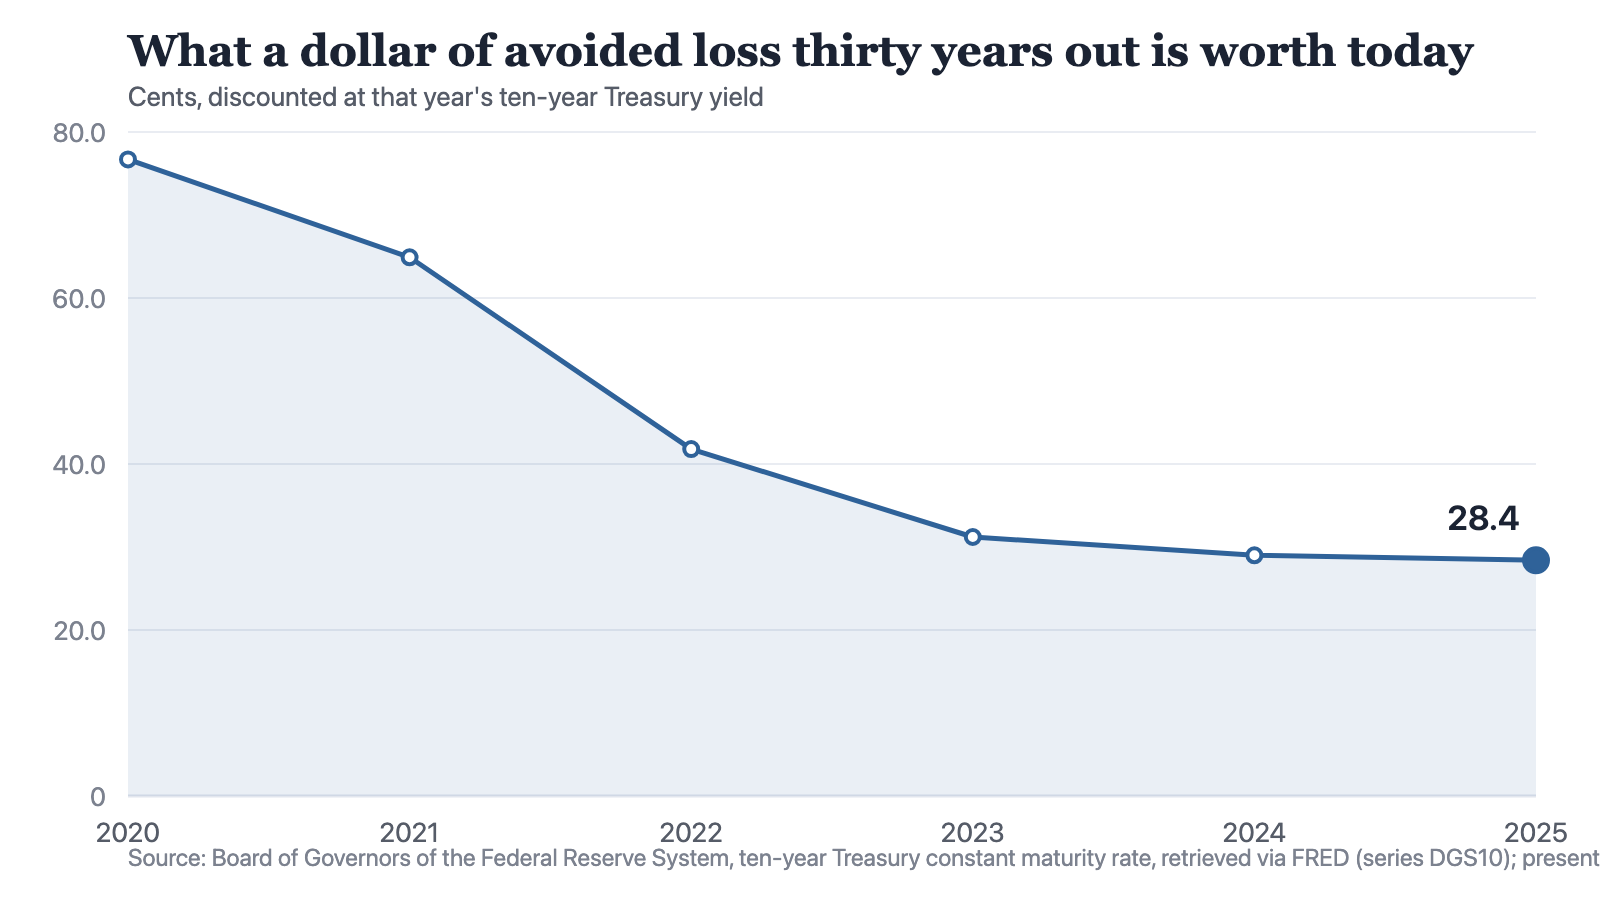
Notes: Present values computed for this piece as one divided by one plus that year's yield, raised to the thirtieth power, stated in cents and rounded to one decimal. The yield is nominal and is held constant across the thirty years. This is arithmetic on a published rate, not a forecast and not a real rate.
Source: The Cefa Brief
Chart description
A line chart of the present value of one dollar arriving in thirty years, discounted at each year's average ten-year Treasury yield. The values are 76.7 cents in 2020, 64.9 cents in 2021, 41.8 cents in 2022, 31.2 cents in 2023, 29.0 cents in 2024 and 28.4 cents in 2025. The line falls at every step. The steepest fall is between 2021 and 2022, and the last three points sit close together. The underlying yields are 0.89, 1.45, 2.95, 3.96, 4.21 and 4.29 percent.
A line chart of the present value of one dollar arriving in thirty years, discounted at each year's average ten-year Treasury yield. The values are 76.7 cents in 2020, 64.9 cents in 2021, 41.8 cents in 2022, 31.2 cents in 2023, 29.0 cents in 2024 and 28.4 cents in 2025. The line falls at every step. The steepest fall is between 2021 and 2022, and the last three points sit close together. The underlying yields are 0.89, 1.45, 2.95, 3.96, 4.21 and 4.29 percent.
Hold the rate still and move the date instead. At 4.29 percent, a dollar arriving in ten years is worth 65.7 cents, the same dollar in thirty years is worth 28.4 cents, and in fifty years 12.2 cents. Those three numbers are the whole asymmetry. A mitigation asset earns from its first year of operation, inside the part of the horizon the arithmetic treats gently. An adaptation asset earns in the decades its design life was chosen to survive, which are the decades the arithmetic has already written down to a fraction.
Nobody is the counterparty
Discounting is only the first obstacle. The second is that the benefit has no obligor. A power purchase agreement names a buyer, a price and a term. A seawall names nobody. Its benefit falls on households, insurers, a port authority, a tax base and a state's contingent liabilities, in proportions nobody computes and no contract records. A benefit with no payer is not a cash flow at all. It is a public good, and a spreadsheet scores a public good at zero.
Where adaptation does reach a private balance sheet, it reaches it at the wrong price. A great deal of the work is retrofit at the scale of a single parcel, and a single parcel borrows in the household market. The thirty-year fixed mortgage rate, in percent, was 2.96 in 2021 and 6.6 in 2025, 3.64 points higher, and the 2025 reading sits 2.31 points above the ten-year of the same year. That is the nearest published price of long household money this site holds. It is not the rate on any resilience retrofit and I am not presenting it as one. It is the order of magnitude a household meets when the work carries no revenue at all.
A mitigation project ends in a receivable. An adaptation project ends in a counterfactual, and a counterfactual nobody has written into the cash flow occupies no row in the model.
The stock being defended got dearer
One more published number, because the asset side moved while the discount side did. The national home-price index, on a January 2000 base of 100, stood at 222.1 in 2020 and 328.5 in 2025, a rise of 106.4 index points, or 47.9 percent. It is a repeat-sales index rather than a price, and it says nothing about where that housing sits or what it is exposed to. What it does establish is that the built stock an adaptation project defends did not stand still across the same window in which the arithmetic used to justify defending it grew harsher.
Three changes to the appraisal
The first change is to the damage baseline. It has to be published as a number rather than carried in a covering note. Appraisal already accepts counterfactuals it cannot observe, since a toll road is appraised against traffic that will not exist if the road is not built. Adaptation is refused the same treatment. The requirement is a stated expected-damage path with the project and without it, its source, and its own error band, and then the difference belongs in the cash flow line where a revenue would sit. An appraisal that declines to state a baseline has not avoided the assumption. It has set it to zero and not said so.
Next comes the rate, which has to be published and has to step down with horizon. The figures above use a single market yield held flat for thirty years, which is a simplification and is named as one here. Public appraisal generally uses a social discount rate instead, and that is the right argument to be having, because the rate is where the decision is actually taken. A schedule that lowers the rate applied to benefits beyond a stated year is a choice an appraisal can make and defend in the open. The narrow requirement is that a reader can see the rate, see the schedule, and reproduce the number without asking anyone.
Last, name the beneficiary and make the beneficiary a payer. The avoided loss lands somewhere. Where it lands on an insurer it can come back as a premium credit; where it lands on a rate base, as a tariff line; where it lands on a tax base, as a levy on the protected parcels. None of that is new financial engineering. It is the ordinary work of finding an obligor, which mitigation completed years ago when it wrote the power purchase agreement, and which adaptation has largely not done.
The objection to all three is obvious and it is correct. A counterfactual nobody can falsify is a licence to claim any benefit at all, and a sponsor asked to supply its own damage baseline will supply a generous one. Anyone arguing this case should concede that first. The answer is not to refuse the baseline but to make it contestable: one published methodology applied to every applicant, the assumptions on the face of the appraisal, and a review able to reject a baseline without rejecting the project. A number that can be attacked is worth more than a narrative that cannot be.
An admission is owed, because this page argues about two categories of climate finance from three series and not one of them is a climate series. This site holds no figure for adaptation finance and none for mitigation finance: no committed volume, no split between them, no project count, no cost of capital for either and no damage estimate, and nothing here invents one. The three series do a narrow job. They establish what the long end of the American curve did between 2020 and 2025, what that does arithmetically to a benefit arriving in thirty years, and what the built stock did over the same window. The rest rests on how an appraisal is constructed, which is a question of method rather than of data.
The useful question at the next appraisal is not whether adaptation deserves more capital. It is which line of the model the avoided loss is written on. At present it is written in the covering note, where no discount rate reaches it and no investment committee has to price it. Until it is written into the cash flow, with a baseline behind it and an obligor in front of it, adaptation will keep arriving at the same test with the same empty column, and it will keep losing to a project that turned up holding a signed contract.
About the author

Each author told us that for this piece they hold no interest a reader would think relevant.
This commentary carries its author's name because the view in it is the author's own. An editor reviewed it before publication, which is not the same as agreeing with it. It is not a position of the Center for Economics & Foreign Affairs or of Applied America.
© 2026. The author or authors hold the copyright in this commentary; CEFA publishes it with their permission. This edition, its editing and its presentation are © 2026 Center for Economics & Foreign Affairs. To republish it, see our republication terms. Republishing
Share
The Cefa Brief · applied.thecefa.org/cefa-brief/an-avoided-loss-has-no-offtaker · Printed from the web edition