
ComentarioStates & Communities
A house price index is not a house price
Maine's house price index stands at 1044.11 and California's at 974.97. Each state's index is anchored at 100 in the first quarter of 1980, which means the ranking measures appreciation since then and says nothing at all about what a house costs.
by
Published 4 minute read

Ilustración: The Cefa Brief
Sort the 51 jurisdictions by house price index and California comes eighth. Above it, in order: Massachusetts at 1326.94, New York at 1184.26, Rhode Island at 1064.86, Maine at 1044.11, the District of Columbia at 1037.72, Washington at 1033.33 and Hawaii at 982.57. California sits at 974.97. Anyone who has bought a house in both Maine and California will find that ordering surprising, and they should, because the ranking is not answering the question they think it is.
My position is that the level of this index should never be compared across states, and that the table which invites you to do so is the most quietly misleading object in regional housing analysis. The series is genuinely useful. It is useful for one thing, and the ranking is not it.
What the base date does
Our dataset records the units as Index 1980Q1=100. Every state is set to 100 in the same quarter, but each state is set to 100 at its own price level. Massachusetts at 1326.94 and West Virginia at 365.44, the lowest in the file, are not two points on one scale. They are two separate scales that happen to share a number, and the only thing the comparison establishes is that housing in Massachusetts has appreciated more since 1980 than housing in West Virginia has.
That is a real finding, and it matters for anyone thinking about household wealth or the assessment base. It is not a finding about cost. A state that was dear in 1980 and is dear now will show a smaller index than a state that was cheap in 1980 and is dear now, purely because the first one had further to travel from a higher start. Nothing in the arithmetic corrects for that, and nothing in the series lets you back out the starting level.
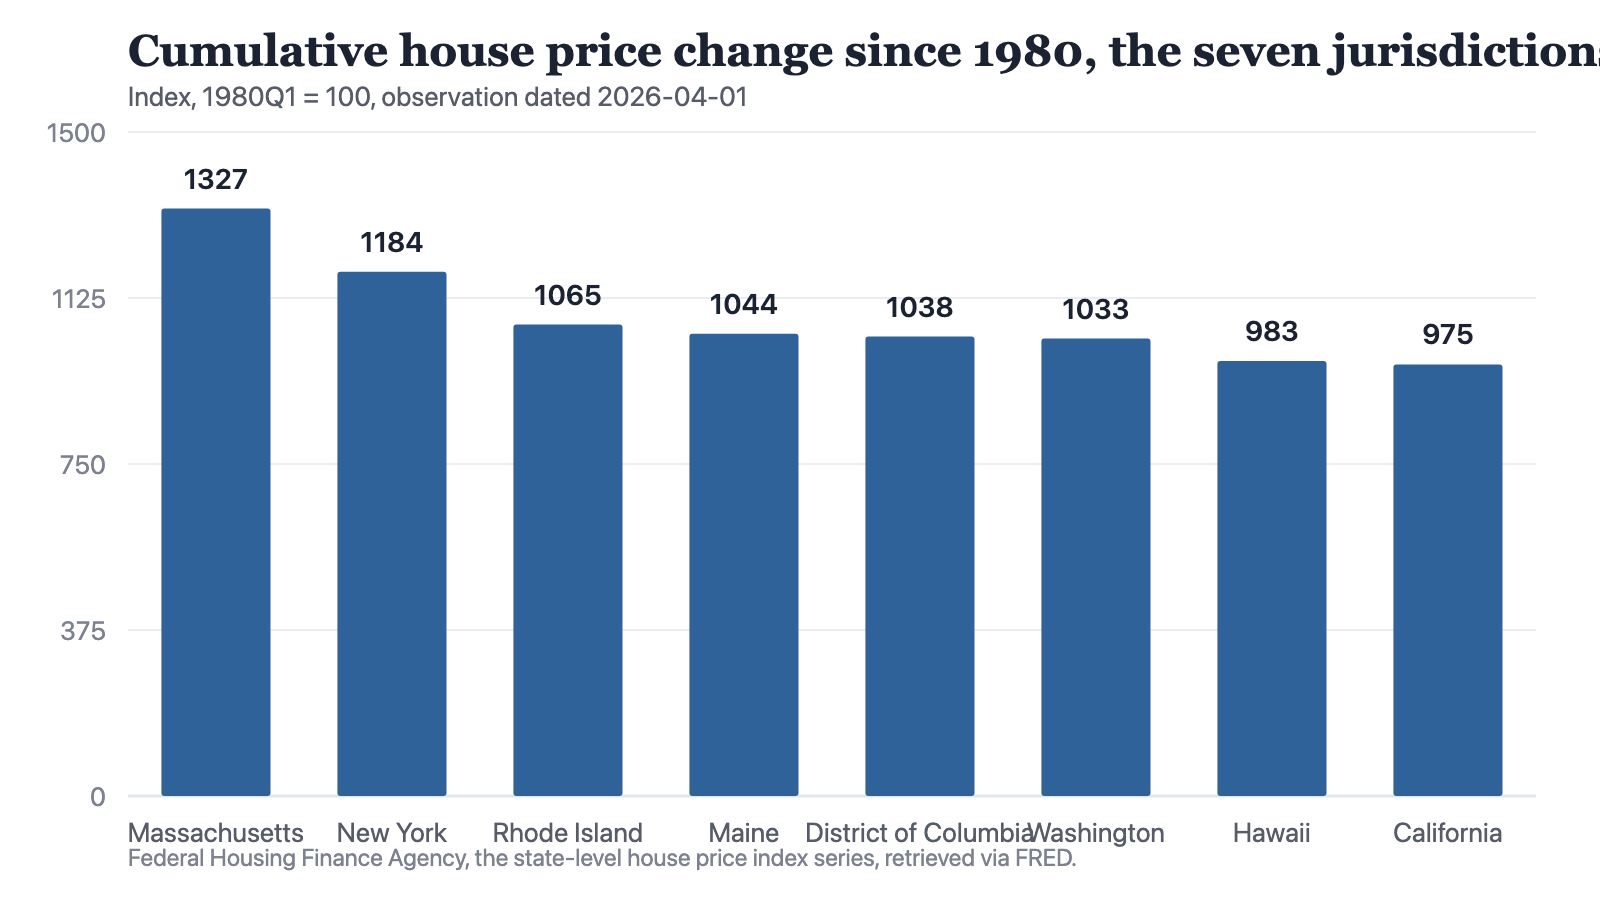
Notes: The seven jurisdictions whose index exceeds California's, plus California. Each bar is that state's cumulative change from its own 1980 base, not a price. The dataset carries no dollar price for any state.
Source: The Cefa Brief
Chart description
Eight bars descending from Massachusetts at 1326.94 to California at 974.97, with New York 1184.26, Rhode Island 1064.86, Maine 1044.11, the District of Columbia 1037.72, Washington 1033.33 and Hawaii 982.57 between them. Read as a price ranking, the chart would say Rhode Island and Maine are dearer than Hawaii and California, which the series gives no basis for. Read correctly, it says those markets have moved further from their 1980 starting points than California's has.
Eight bars descending from Massachusetts at 1326.94 to California at 974.97, with New York 1184.26, Rhode Island 1064.86, Maine 1044.11, the District of Columbia 1037.72, Washington 1033.33 and Hawaii 982.57 between them. Read as a price ranking, the chart would say Rhode Island and Maine are dearer than Hawaii and California, which the series gives no basis for. Read correctly, it says those markets have moved further from their 1980 starting points than California's has.
This is not a subtle failure mode. It puts Maine above California and Rhode Island above Hawaii. Anyone using the ranking to argue about affordability, or to decide where a workforce can be housed, is reading a forty-six-year appreciation record as a current price list.
What the series is for
Within a single state, across time, the index does exactly what it was designed to do. California's index moved from 975.22 in the observation dated 2026-01-01 to 974.97 in the observation dated 2026-04-01, which is as close to unchanged as a quarter gets. Hawaii went from 944.79 to 982.57 over the same quarter. The District of Columbia fell, from 1053.66 to 1037.72. Those three statements are sound, they are comparable with each other because each is a change measured against that state's own prior quarter, and none of them requires knowing what a house costs.
Run both cuts side by side and they barely relate. West Virginia holds the lowest index level of the 51 jurisdictions at 365.44, and its move from 355.05 in the January observation to 365.44 in the April one is the fourth largest quarterly change in the file. The District of Columbia is fifth on the level table and last of the 51 on the quarter. A state's position on the ranking tells you almost nothing about what its market is doing now, which is a useful reminder that these are two different questions wearing one label.
That is the discipline the instrument imposes. It measures movement, not position. Every honest use of it is a sentence with the word changed in it.
The objection
The strongest objection is that this is pedantry dressed as rigour. Practitioners know the index is an index. The word is in the name. If someone wants a price they look up a median sale price, and the fact that an index level is not a price has never actually fooled a professional.
I would accept that if the tables were built differently. But the ranking is published sorted, with a label reading house price index, and a sorted column of numbers under that label is a claim about order. It is not the professionals I worry about. It is the memo three steps downstream, where the ranking has become a sentence, the sentence has lost the word index, and a decision about where to build housing for a workforce is being defended with a number that was never about cost.
The second objection is better: the appreciation ranking is itself decision-relevant, so publish it and let readers use it properly. That I agree with, and it is why the chart above is titled as cumulative change rather than as a price. The title is doing load-bearing work. Strip it and the same eight bars become a false statement.
There is a limit to what two observations license, and I would rather set it myself. Our dataset holds one quarter and its predecessor, nothing longer. It cannot tell you whether a state's appreciation is accelerating, whether a quarterly fall is a turn or noise, or where any market sits in its own cycle. What it can tell you, cleanly, is how far each state has come from 1980 and what happened in the last three months. If somebody needs a house price, the honest answer is that we do not have one, and the second-honest answer is the one to avoid: handing them an index and letting the label do the lying.
About the author

Each author told us that for this piece they hold no interest a reader would think relevant.
This commentary carries its author's name because the view in it is the author's own. An editor reviewed it before publication, which is not the same as agreeing with it. It is not a position of the Center for Economics & Foreign Affairs or of Applied America.
© 2026. The author or authors hold the copyright in this commentary; CEFA publishes it with their permission. This edition, its editing and its presentation are © 2026 Center for Economics & Foreign Affairs. To republish it, see our republication terms. Republishing
Share
The Cefa Brief · applied.thecefa.org/cefa-brief/a-house-price-index-is-not-a-house-price · Printed from the web edition