
Research spending has no down year, and its largest annual addition was in 2022
The quarterly average rose from 754 billion dollars in 2020 to 1,081 billion in 2025, 327 billion higher across five steps. The largest of those steps, 103 billion, came in 2022, and the three years since have added 139 billion between them.
by
Published Corrected 2 minute read

رسم توضيحي: The Cefa Brief
Research and development investment recorded inside gross domestic product rose in every year of the window. The annual rate went from 754 billion dollars in 2020 to 1,081 billion in 2025, an increase of 327 billion. There is no down year in the series.
The six readings are 754 in 2020, 839 in 2021, 942 in 2022, 991 in 2023, 1,029 in 2024 and 1,081 in 2025, all in billions of dollars at a seasonally adjusted annual rate.
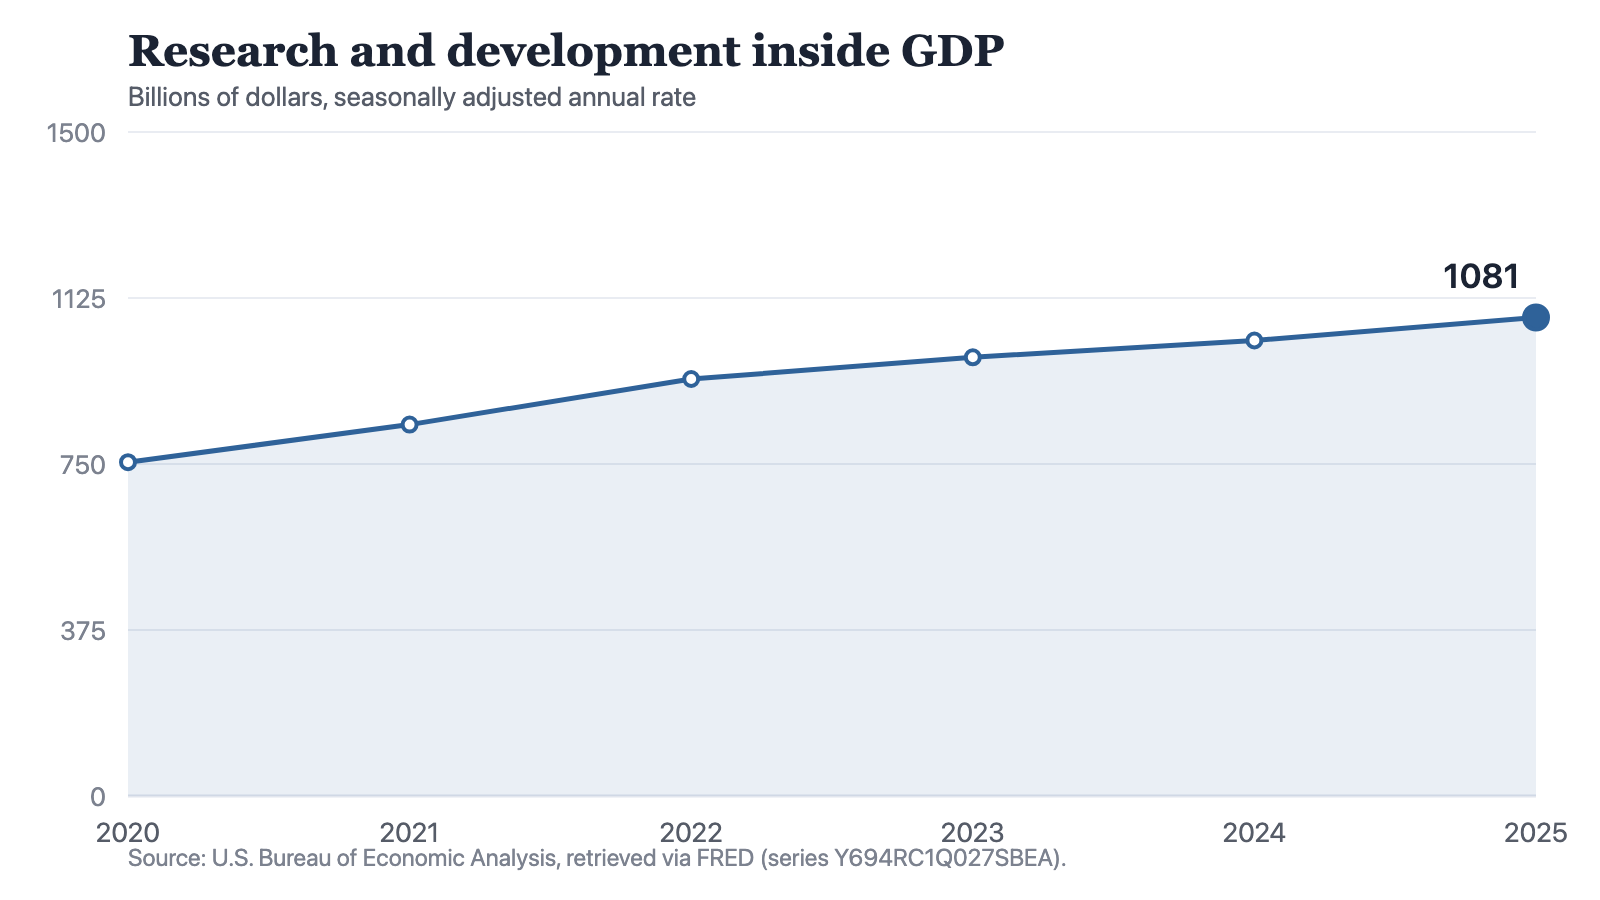
Notes: Annual observations. Each quarterly reading is already stated at a yearly rate, so each point stands as that year’s rate, not one quarter’s or one month’s spending.
Source: The Cefa Brief
Chart description
A line chart of research and development inside GDP, in billions of dollars at a seasonally adjusted annual rate: 754 billion in 2020, 839 in 2021, 942 in 2022, 991 in 2023, 1,029 in 2024 and 1,081 in 2025. The line rises at every step, most steeply between 2021 and 2022 and least steeply between 2023 and 2024.
A line chart of research and development inside GDP, in billions of dollars at a seasonally adjusted annual rate: 754 billion in 2020, 839 in 2021, 942 in 2022, 991 in 2023, 1,029 in 2024 and 1,081 in 2025. The line rises at every step, most steeply between 2021 and 2022 and least steeply between 2023 and 2024.
The additions, not the level
Year on year the series added 85 billion, then 103, then 49, then 38, then 52. The largest addition is the second one, in 2022. The smallest is 2024, at 38 billion. The 2025 addition of 52 billion is barely more than half the 2022 addition, and it is the third largest of the five.
Set the two parts of the window side by side. The first two steps added 188 billion between them. The last three added 139 billion between them. More of the five-year rise arrived in two years than in the three that followed. The level says the series is at its highest reading of the window. The additions say the pace at which it got there fell by more than half after 2022 and has since recovered only part of the difference.
Money in, not results out
The series measures spending, not what the spending produced. Computer and electronic product output, on an index with 2017 at 100, reads 105.7 in 2020, 110.3 in 2021, 117 in 2022, 116.6 in 2023, 118.3 in 2024 and 126.8 in 2025. In 2023 research spending added 49 billion dollars and that index fell, by 0.4 of a point. In 2025 the index took its largest step of the window, 8.5 points, while the research addition of 52 billion was only its third largest. Those are two series on different bases and nothing here divides one by the other. The point is narrow: an input counted in dollars and the output of one product group did not move together, year by year.
What the figure is
Two features of the measure shape what can be read from it. The unit is billions of dollars at a seasonally adjusted annual rate, so each quarterly reading already states spending at a yearly pace and the annual point stands as the year's own rate;the figure is neither one quarter's spending nor one month's. And the dollars are current dollars, with no price base in the unit, so a rise in this line can be more research, dearer research, or both. No figure in this piece has been adjusted for prices.
Two things would change the reading. A price index for research spending, applied to this series, would separate the volume of work from its cost; this brief holds no such index and has not estimated one. And the series as stored here is a single line, with no split by industry, by type of work or by who performed it, so it cannot say where the slowdown after 2022 sits. Until either exists, the defensible sentence is the narrow one. Research and development investment inside GDP rose every year, and the two years that added most were 2021 and 2022.
Updates and corrections
Correction ·
Corrected 19 September 2026. An earlier version of this piece described research and development investment as a quarterly average. The Bureau of Economic Analysis publishes this series at a seasonally adjusted annual rate, so each figure states a yearly rate rather than one quarter's spending. Every figure and comparison in the piece is unchanged; what was wrong was the description of what the figures measure. The chart has been redrawn with the corrected unit.
Correction ·
Corrected 19 September 2026. An earlier version added that reading a figure as a single month's would understate it by roughly a factor of twelve. That had the relationship the wrong way round: the figure is already stated at a yearly rate, so reading it as one month's overstates that month. The sentence has been removed rather than reversed, because the method note already says plainly that each point is a yearly rate and approximates the year. No figure in the piece has changed.
Method and data
The figures are annual observations of research and development investment recorded inside gross domestic product, series Y694RC1Q027SBEA, published by the U.S. Bureau of Economic Analysis, redistributed by FRED and retrieved for this site on 19 September 2026. The unit is billions of dollars at a seasonally adjusted annual rate, which means each quarterly observation is already stated at a yearly pace and the annual point is the average of those four, so each point stands as that year's own rate of research and development investment. It is not one quarter's spending and not one month's:1,081 billion in 2025 is roughly a year's worth. Nothing here multiplies the figure up to reach a year, because it is already a yearly rate. The dollars are current dollars with no price base attached to the unit, so the series does not separate more research from dearer research, and nothing in this piece is a price-adjusted research figure. The series is a spending measure. It does not record what was researched, how the money divided between basic and applied work, which industries or states spent it, or what any of it produced. The computer and electronic product output index cited in the text, series IPG334S, is a separate series from a separate agency, stated as an index with 2017 at 100; it is named for contrast only, it covers one product group rather than the whole economy, and no figure here is divided by another.
How to cite
Jag DeSaint, "Research spending has no down year, and its largest annual addition was in 2022," The Cefa Brief, Applied America, 25 مارس 2026, https://applied.thecefa.org/cefa-brief/research-dollars-are-not-results. Updated 19 سبتمبر 2026.
About the author

Each author told us that for this piece they hold no interest a reader would think relevant.
This Insights piece carries its author's name because the view in it is the author's own. An editor reviewed it before publication, which is not the same as agreeing with it. It is not a position of the Center for Economics & Foreign Affairs or of Applied America.
© 2026. The author or authors hold the copyright in this Insights piece; CEFA publishes it with their permission. This edition, its editing and its presentation are © 2026 Center for Economics & Foreign Affairs. To republish it, see our republication terms. Republishing
Share
The Cefa Brief · applied.thecefa.org/cefa-brief/research-dollars-are-not-results · Printed from the web edition