
Before the next plant, explain the idle line
American manufacturing used 75.3 percent of its capacity in 2025, against 77.6 percent in 2022. A programme that pays to add capacity without accounting for the capacity already standing is not an industrial policy. It is a construction policy.
by
Published 4 minute read

رسم توضيحي: The Cefa Brief
The case for the last five years of industrial policy has been made almost entirely in the language of construction. Plants announced. Ground broken. Ribbons cut. Investment totals read out from a podium as though a dollar committed were a thing produced. I want to set one number against that vocabulary. In 2025 American manufacturing used 75.3 percent of its capacity. In 2022 it used 77.6 percent. The line has not risen in any of the three annual readings since.
My position is that a programme paying to build new industrial capacity, in a sector that is using less of its existing capacity than it did three years ago, owes the public an account of why the existing capacity is quiet. Not a forecast of when it will fill. An account of why it is not full now. Until that account exists, each new incentive is being designed without anyone having established what it is meant to fix, and a policy that has not established the problem is not in a position to claim the solution.
It is worth being exact about what the measure is, because the exactness is the whole argument. Capacity utilisation is output divided by an estimate of what the installed plant could sustainably produce. It is a ratio. It is not a count of factories, not a count of workers, not a measure of profit. It is the fraction of the industrial base that is doing something on an average day.
What the six readings actually say
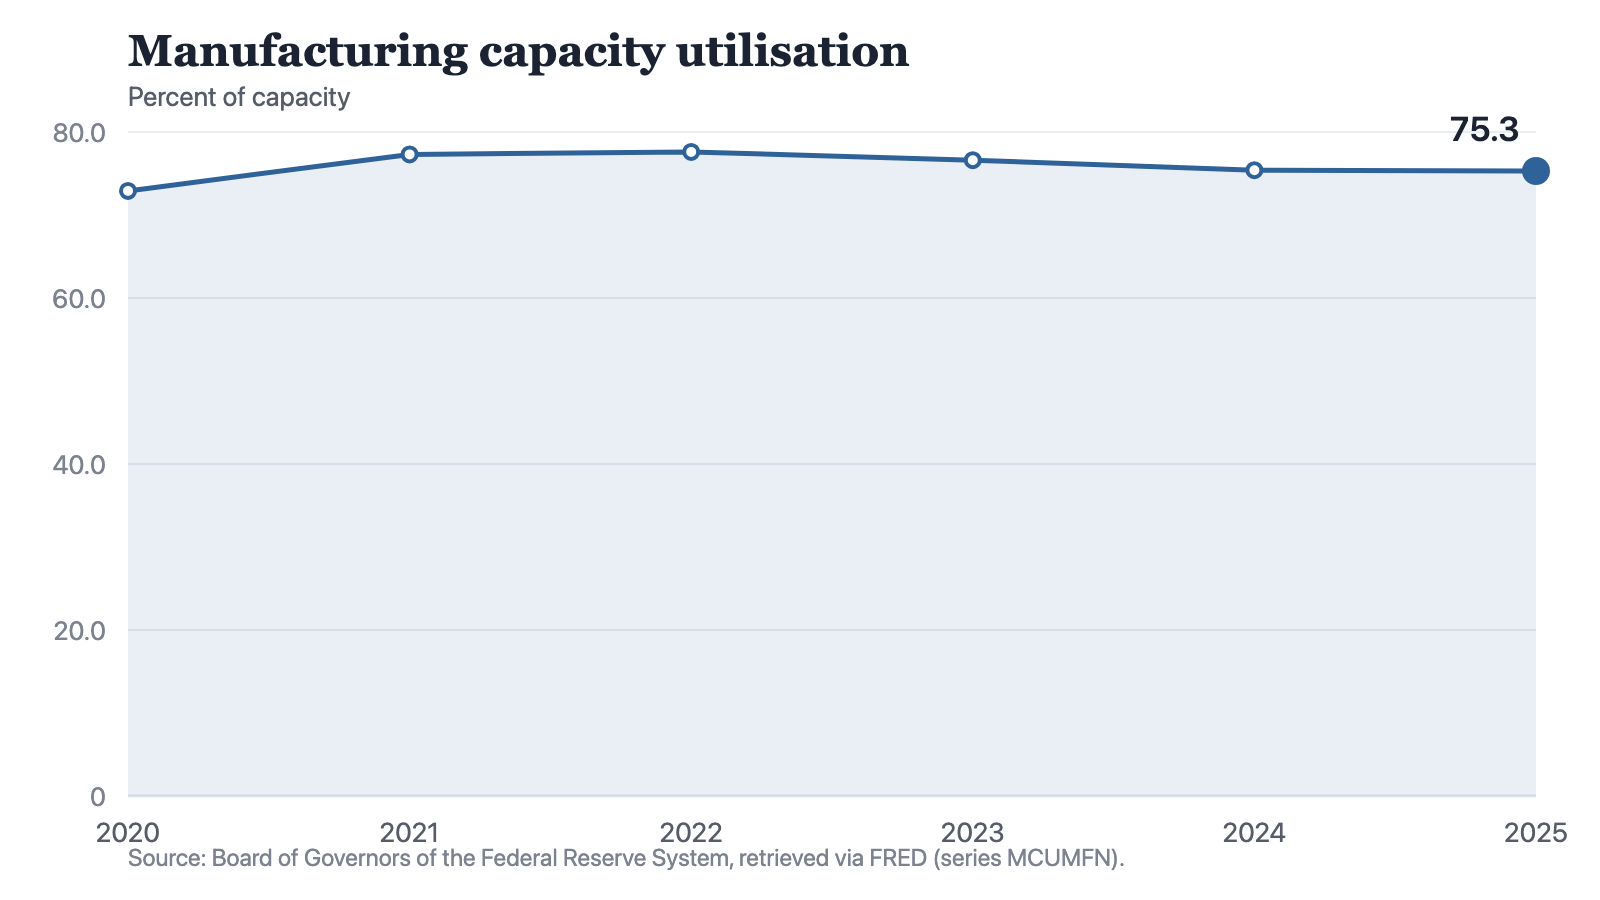
The series runs 72.9 percent in 2020, 77.3 in 2021, 77.6 in 2022, 76.6 in 2023, 75.4 in 2024 and 75.3 in 2025. Two things are true at the same time, and the argument in public tends to pick one and drop the other. Utilisation is 2.4 points above where it stood in the shutdown year. It is also 2.3 points below the 2022 reading, having fallen in every observation since.
Notes: A ratio with capacity in the denominator. The series does not identify whether a change originated in output or in installed capacity.
Source: The Cefa Brief
Chart description
A line chart of manufacturing capacity utilisation showing 72.9 percent in 2020, a sharp recovery to 77.3 in 2021 and a peak of 77.6 in 2022, then three consecutive declines to 76.6 in 2023, 75.4 in 2024 and 75.3 in 2025. The final decline, from 75.4 to 75.3, is very small.
A line chart of manufacturing capacity utilisation showing 72.9 percent in 2020, a sharp recovery to 77.3 in 2021 and a peak of 77.6 in 2022, then three consecutive declines to 76.6 in 2023, 75.4 in 2024 and 75.3 in 2025. The final decline, from 75.4 to 75.3, is very small.
The most recent move is almost nothing. From 75.4 to 75.3 is a tenth of a point, and I am not going to dress a tenth of a point as a collapse. What that reading describes is a line that has stopped falling rather than one that has started rising. It is the difference between a patient who is no longer deteriorating and a patient who is recovering, and three consecutive years is long enough that this is a state of affairs rather than a wobble in the data.
The strongest objection
The objection I take seriously is arithmetic, and it is a good one. Utilisation is a ratio, and capacity sits in the denominator. If a country adds capacity quickly, the ratio can fall even while output rises, simply because the bottom of the fraction grew faster than the top. On that reading a declining line is not a symptom of failure at all. It is the signature of success: proof that the new plants are real, that they were installed, and that they arrived ahead of the demand for what they make.
That objection has real force and the series on its own cannot refute it. A ratio never tells you which half moved. Anyone quoting these six numbers as evidence of industrial decline is over-reading them, and that includes anyone reaching for them to attack a programme they already disliked. I would rather concede this plainly than win the point dishonestly.
But the concession cuts both ways, and this is where the argument turns. If the denominator is what moved, then installed capacity is the achievement, and installed capacity is the number that ought to be quoted beside the utilisation rate every single time the rate is cited. It almost never is. What gets read out instead is the investment total, and an investment total is a price, not a thing. Five years into a programme whose entire premise is adding industrial capacity, the quantity added is not the figure anyone is held to. A policy that will not nominate its own headline measure is asking to be judged on ribbon-cuttings, because ribbon-cuttings are what it can reliably count.
What to ask before the next incentive
- How much manufacturing capacity was added in each of the last three years, stated as a quantity of capacity and not as a sum of money committed?
- In the specific sectors receiving support, is utilisation of the lines already standing rising or falling?
- If utilisation is falling because capacity is growing, in which year are the new lines expected to run full, and what is the plan for them if that year does not arrive?
None of those questions requires forecasting the economy, and none of them requires a view on whether the programmes were wise. They ask a programme to state what it is building and what it expects the building to be used for. That is an ordinary condition of any capital commitment. No private lender releases a second tranche without it, and the fact that public capital is released without it is a choice rather than a constraint.
The 2.3-point gap between 2022 and 2025 may turn out to be nothing at all. It may turn out to be the most expensive thing on the page. The reason we cannot say from this series alone is that a ratio conceals which half of it moved. That is an argument for publishing the other half beside it, not an argument for looking away from the ratio.
About the author

Each author told us that for this piece they hold no interest a reader would think relevant.
This commentary carries its author's name because the view in it is the author's own. An editor reviewed it before publication, which is not the same as agreeing with it. It is not a position of the Center for Economics & Foreign Affairs or of Applied America.
© 2025. The author or authors hold the copyright in this commentary; CEFA publishes it with their permission. This edition, its editing and its presentation are © 2025 Center for Economics & Foreign Affairs. To republish it, see our republication terms. Republishing
Share
The Cefa Brief · applied.thecefa.org/cefa-brief/explain-the-idle-line · Printed from the web edition