
Half the capacity use gained after 2020 has since been given back
Manufacturing capacity utilisation rose 4.7 points between 2020 and 2022, and 4.4 of them arrived in the first year. It has given back 2.3 points in the three years since.
by
Published 3 minute read

رسم توضيحي: The Cefa Brief
The interesting thing about manufacturing capacity utilisation over the last six years is not the level. It is the asymmetry. The series climbed 4.7 points between its 2020 trough and its 2022 peak, and it has since given back 2.3 of them. The climb took two years, and almost all of it took one. The give-back has taken three years and is not obviously finished.
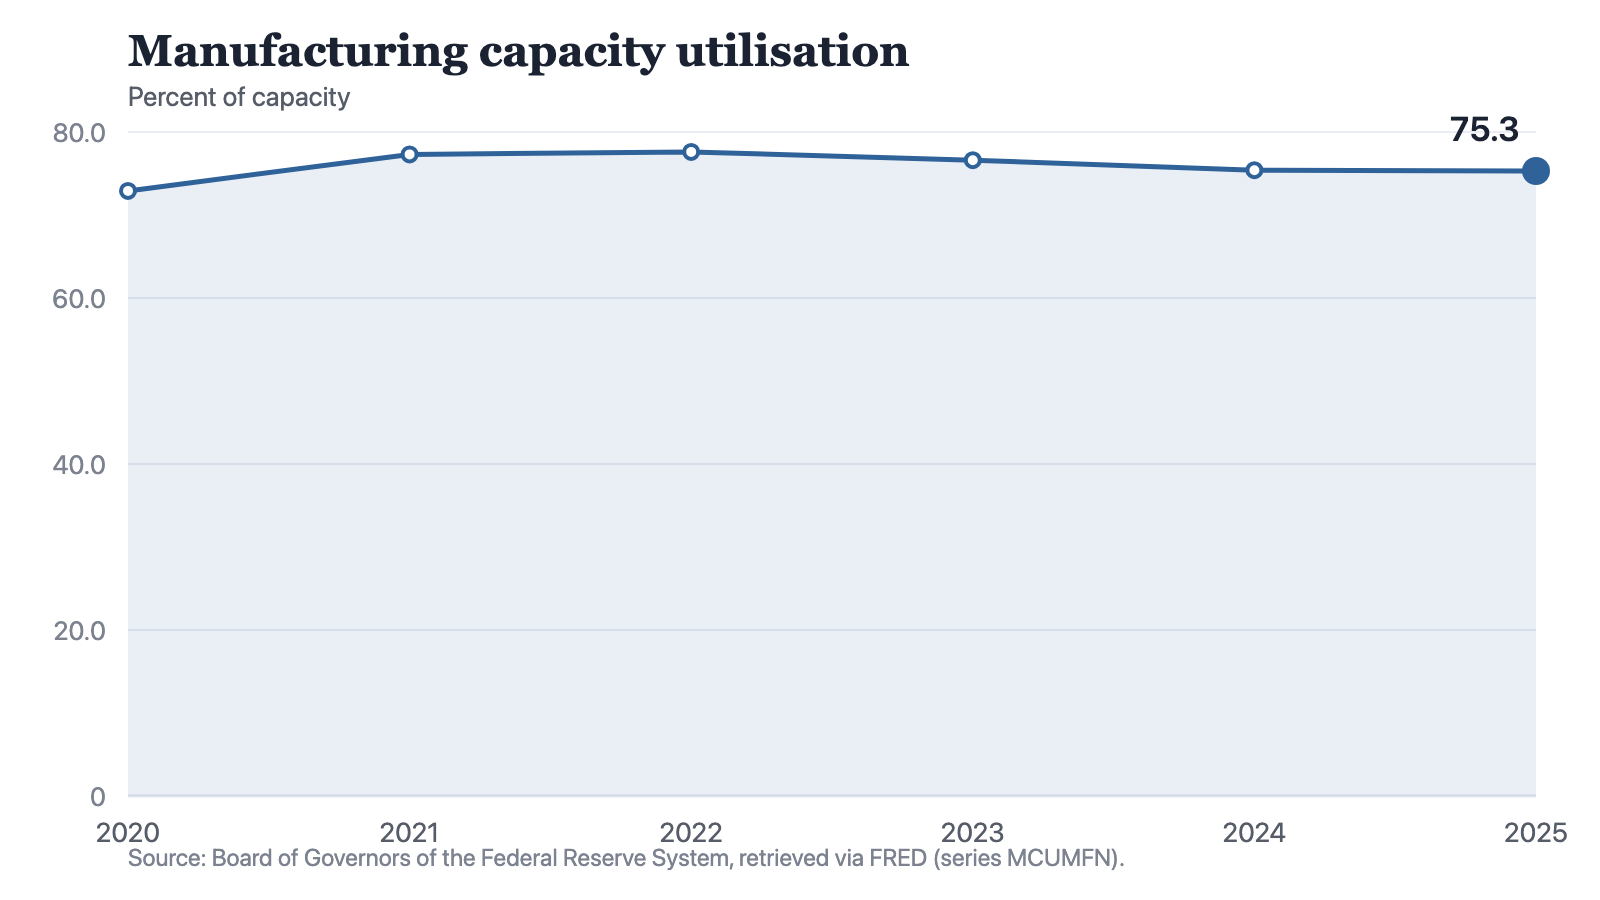
The six readings, in order, are 72.9 percent in 2020, 77.3 in 2021, 77.6 in 2022, 76.6 in 2023, 75.4 in 2024 and 75.3 in 2025.
The climb was a single year
Between 2020 and 2021 the measure moved 4.4 points, from 72.9 to 77.3. Between 2021 and 2022 it moved 0.3, from 77.3 to 77.6. The peak year added almost nothing. If you were tracking the recovery in how hard American factories were being worked, it was effectively over by the end of 2021, and 2022 is the top of the series by three tenths of a point.
Notes: Annual observations, manufacturing only. A change in this ratio can come from the output side or the capacity side; the series does not separate them.
Source: The Cefa Brief
Chart description
A line chart showing utilisation at 72.9 percent in 2020, jumping to 77.3 in 2021 and edging up to a peak of 77.6 in 2022, then falling to 76.6 in 2023 and 75.4 in 2024 and ending at 75.3 in 2025. The single steepest segment by far is the first one.
A line chart showing utilisation at 72.9 percent in 2020, jumping to 77.3 in 2021 and edging up to a peak of 77.6 in 2022, then falling to 76.6 in 2023 and 75.4 in 2024 and ending at 75.3 in 2025. The single steepest segment by far is the first one.
This is worth stating because 2022 is the year usually cited as the high-water mark, and the citation carries an implication that something was still building through that year. In this series nothing much was. The distance between 2021 and 2022 is smaller than the distance between any two consecutive readings in the decline that followed, apart from the last pair.
The give-back took three
From the 2022 peak the series fell 1.0 point to 76.6, then 1.2 points to 75.4, then 0.1 to 75.3. The three falls together come to 2.3 points, just under half of the 4.7 points gained on the way up. No single year of the decline comes close to the 4.4-point move that started the window. This is a slow unwind, not a break.
The level that leaves is worth naming plainly. At 75.3 percent, 2025 is the lowest reading in the series apart from 2020 itself. It sits below 2021, below 2022 and below 2023. A reader who anchors on the 2022 peak sees a modest retreat. A reader who anchors on 2021, the first year after the trough, sees the whole of that year's position surrendered and then some.
It took one year to gain 4.4 points and three years to hand back 2.3. Recoveries in this series are fast and its retreats are patient.
What one ratio cannot tell you
Utilisation is a share: the part of manufacturing capacity actually in use. Every movement above is a movement in a ratio, and a ratio can change from either side. Output can move, or capacity can. The series does not say which, and the capacity estimate that would answer it is not held on this site. I am reporting the shape of the line, not a diagnosis of what produced it.
That limit is a reason to read the levels rather than the direction. The direction has been the same for three years and tells you almost nothing on its own. The levels tell you that the factory base is being worked less hard than at any point since 2020, and that the gap has widened gradually rather than suddenly, which is a different problem from a shock and usually a slower one to notice.
The last observation deserves its own caution. From 75.4 to 75.3 is a tenth of a point, the smallest move this series can report at the precision it is published to. It may be the floor of the decline or it may be a pause in it. I would not call it either until there is another reading, and neither should anyone quoting these six numbers to argue that the line has turned.
Method and data
The figures are annual observations of manufacturing capacity utilisation, series MCUMFN, published by the Board of Governors of the Federal Reserve System, redistributed by FRED and retrieved for this site on 19 September 2026. The series covers manufacturing only and states the share of capacity in use, in percent. Every comparison here is between two published readings of that one series; nothing is deflated, weighted or annualised. It is not a measure of output, employment or profitability, and on its own it does not show whether a change came from the output side or the capacity side, because the underlying capacity series is not held on this site.
How to cite
Jag DeSaint, "Half the capacity use gained after 2020 has since been given back," The Cefa Brief, Applied America, 12 نوفمبر 2025, https://applied.thecefa.org/cefa-brief/capacity-use-gave-back-half-its-gain.
About the author

Each author told us that for this piece they hold no interest a reader would think relevant.
This Insights piece carries its author's name because the view in it is the author's own. An editor reviewed it before publication, which is not the same as agreeing with it. It is not a position of the Center for Economics & Foreign Affairs or of Applied America.
© 2025. The author or authors hold the copyright in this Insights piece; CEFA publishes it with their permission. This edition, its editing and its presentation are © 2025 Center for Economics & Foreign Affairs. To republish it, see our republication terms. Republishing
Share
The Cefa Brief · applied.thecefa.org/cefa-brief/capacity-use-gave-back-half-its-gain · Printed from the web edition