
The low point of this vehicle sales window is 2022, not 2020
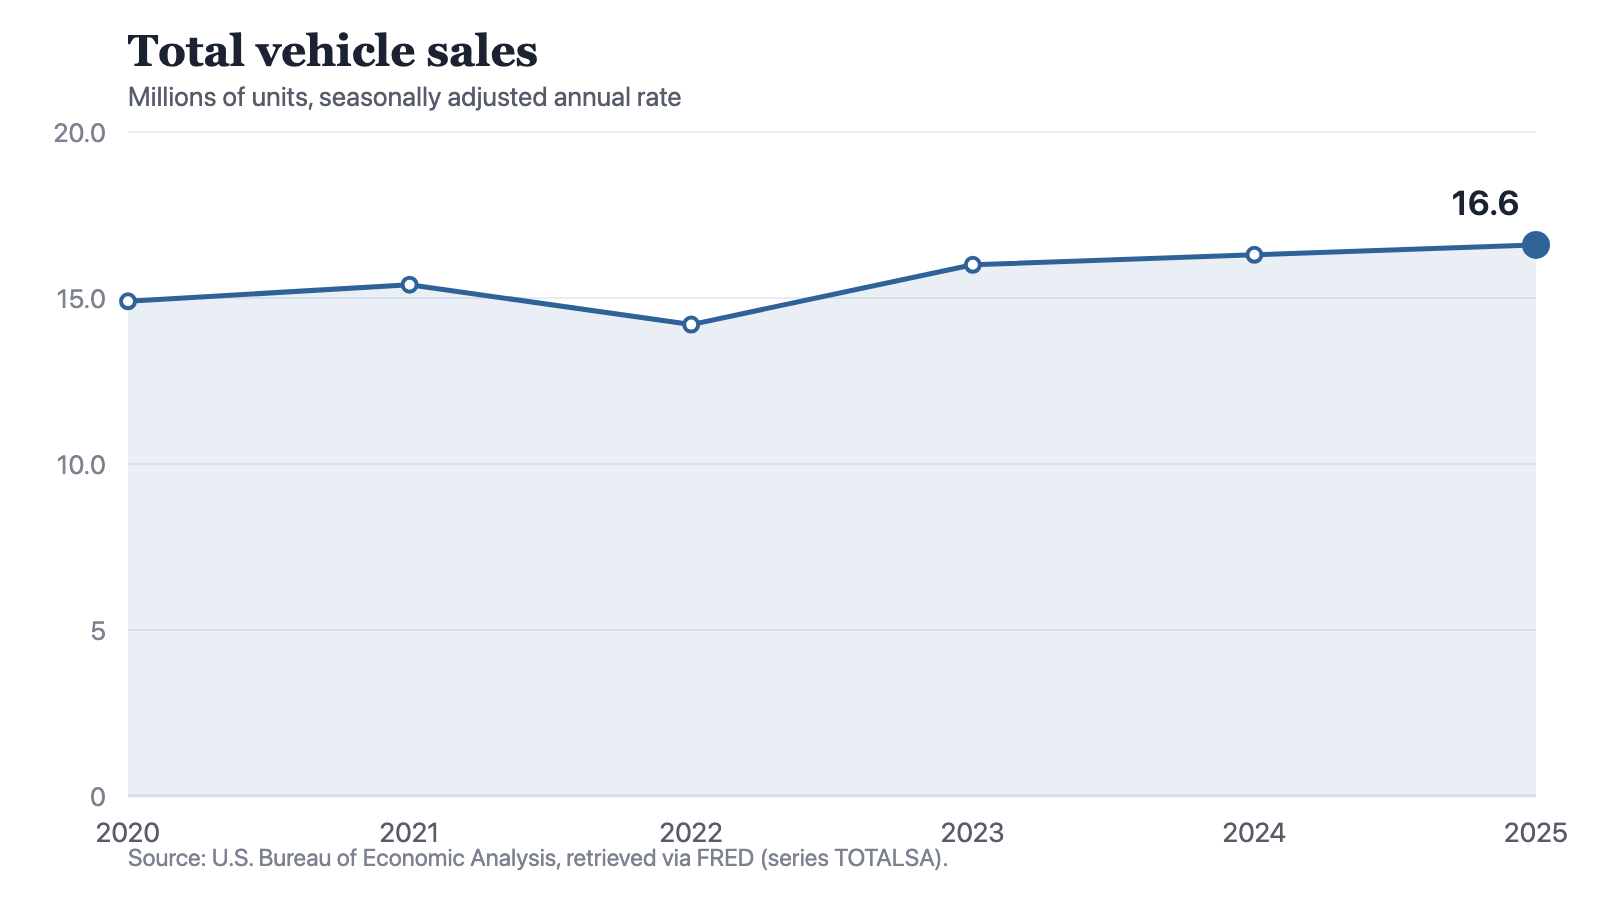
The annual rate ran 14.9 million units in 2020, rose to 15.4 in 2021, then fell to 14.2 in 2022, the lowest of the six readings. Three quarters of the recovery since arrived in a single step, and the two years after it added 0.3 million units each.
by
Published Corrected 3 minute read

Ilustración: The Cefa Brief
This window holds six readings and therefore five year-on-year changes. Only one of them is negative, and it falls in 2022. The annual rate was 14.9 million units in 2020, 15.4 million in 2021 and 14.2 million in 2022. The 2022 reading is the lowest of the six and sits 0.7 million units below the 2020 reading.
Every other step in the window points upward. From 14.2 million in 2022 the series went to 16 million in 2023, 16.3 million in 2024 and 16.6 million in 2025. The last of those is the highest reading on the chart.
Where the recovery actually happened
Between 2022 and 2025 the annual rate gained 2.4 million units. Of that, 1.8 million arrived in the single step from 2022 to 2023, three quarters of the whole move. The two years since have added 0.3 million units each, a sixth of that first step apiece. A series sitting at its window high is also a series that has been climbing at a sixth of its earlier pace.
Notes: Each monthly reading is already stated at a yearly rate, so a point approximates that year's own sales and not a single month's. The series counts units sold and carries no price information.
Source: The Cefa Brief
Chart description
A line chart of total vehicle sales at a seasonally adjusted annual rate in millions of units: 14.9 in 2020, 15.4 in 2021, 14.2 in 2022, 16 in 2023, 16.3 in 2024 and 16.6 in 2025. The line rises by 0.5 into 2021, falls by 1.2 into 2022 to the lowest point of the six, then rises by 1.8 into 2023 and by 0.3 in each of the two years after, ending at its highest point of the window.
A line chart of total vehicle sales at a seasonally adjusted annual rate in millions of units: 14.9 in 2020, 15.4 in 2021, 14.2 in 2022, 16 in 2023, 16.3 in 2024 and 16.6 in 2025. The line rises by 0.5 into 2021, falls by 1.2 into 2022 to the lowest point of the six, then rises by 1.8 into 2023 and by 0.3 in each of the two years after, ending at its highest point of the window.
Anyone reaching for this series as a record of what the pandemic did to vehicle buying will find that it starts too late to answer the question. The first reading here is 2020 itself, and there is nothing before it to measure that year against, so the series cannot say whether 14.9 million was already a fall. What it does show is that the 2020 reading of 14.9 million sits above the 2022 reading of 14.2 million, and that 2023 posted the largest step in the window. The chart records the readings. It does not say why.
Units and dollars in the same year
Retail and food services sales, a separate Census series stated in billions of dollars at a monthly rate, rose from 601.2 billion in 2021 to 656 billion in 2022, a gain of 54.8 billion a month. In that same year vehicle sales fell by 1.2 million units at an annual rate. The two series are stated on different clocks, one a month and one a year, so the two changes cannot be set against each other as though they covered the same span. They are not in conflict, and neither one corrects the other.
The difference is in what is being counted. A dollar series moves when people buy more and when the same thing costs more, and the published figure does not separate the two. A unit series has no price in it at all. I have not divided one of these series by the other, and nothing in this piece is a real or deflated figure.
A dollar total can rise on price alone. A count of units cannot.
What the point on the chart is
Each point is a seasonally adjusted annual rate. The 2025 figure of 16.6 million units is the yearly pace the year's monthly readings were already stated at, so it approximates the vehicles sold across 2025 and not the vehicles sold in any one month of it. The same holds for all six points. The retail series quoted earlier is stated the other way round, at a monthly rate, so a figure from one series and a figure from the other are not on the same clock. Nothing here sets them against each other as though they were.
The series is also, in the end, one number a year. It holds no split between light and heavy vehicles, no indication of what was paid, and nothing about where any vehicle was built. It counts sales. A reader using it to argue about domestic manufacturing is putting a production question to a sales series, and needs a production series instead.
The firmest sentence about this series is also the shortest. Vehicle sales, as a seasonally adjusted annual rate in millions of units, show one decline across the five year-on-year changes this window contains, and it falls in 2022; they have risen in each of the three years since, most of that in the first of them; and 2025, at 16.6 million, is the highest reading on the chart. The series explains none of it, and I would rather name that limit than write past it.
Updates and corrections
Correction ·
Corrected 19 September 2026. An earlier version stated the relationship between the two series' clocks the wrong way round in both directions, saying that a yearly-rate figure read as one month would understate it and that a monthly-rate figure read as a year would overstate it. Both are reversed. The arithmetic has been removed and the two conventions are now simply named, since the piece's point is that they are not on the same clock. No figure in the piece has changed.
Method and data
The figures are annual observations of total vehicle sales, series TOTALSA, published by the U.S. Bureau of Economic Analysis, redistributed by FRED and retrieved for this site on 19 September 2026. They are stated in millions of units at a seasonally adjusted annual rate, so each monthly reading is already expressed as a yearly pace and the annual point approximates the vehicles sold across that year rather than the vehicles sold in any single month of it. The series is a single number a year. It holds no split by vehicle type, no indication of what was paid, and nothing about where any vehicle was built, and it records sales rather than production.
Retail and food services sales, series RSAFS from the U.S. Census Bureau, is quoted once for contrast on the same retrieval date. It is stated in billions of dollars at a monthly rate, the opposite convention to the vehicle series. It is named here to set a dollar measure beside a unit measure. It is not used to deflate anything, and no figure in this piece is a real or price-adjusted figure.
The stored series begins in 2020 and holds six annual points. It carries nothing earlier, so it cannot show how the 2020 reading compares with the years before it, and no sentence here should be read as making that comparison.
How to cite
Jag DeSaint, "The low point of this vehicle sales window is 2022, not 2020," The Cefa Brief, Applied America, 8 de agosto de 2025, https://applied.thecefa.org/cefa-brief/units-fell-while-dollars-rose. Updated 19 de septiembre de 2026.
About the author

Each author told us that for this piece they hold no interest a reader would think relevant.
This Insights piece carries its author's name because the view in it is the author's own. An editor reviewed it before publication, which is not the same as agreeing with it. It is not a position of the Center for Economics & Foreign Affairs or of Applied America.
© 2025. The author or authors hold the copyright in this Insights piece; CEFA publishes it with their permission. This edition, its editing and its presentation are © 2025 Center for Economics & Foreign Affairs. To republish it, see our republication terms. Republishing
Share
The Cefa Brief · applied.thecefa.org/cefa-brief/units-fell-while-dollars-rose · Printed from the web edition