
PerspectivaInternational Partners
Openness and security are being reconciled by narrowing one channel at both ends rather than by closing the economy
Two-way U.S. goods trade with mainland China ran at 58 billion dollars a month in 2022 and 35 billion in 2025, a fall of 39.7 percent, while total imports and exports of goods and services both rose across the same three years. The channel narrowed at both ends, and no series cited here records whether a screen decided any of it.
by
Vantage point
The vantage decides what the rest of this can claim, so it belongs at the front. I am an analyst writing inside The Cefa Brief, working from published statistics and public documents and from nothing else: annual series redistributed by FRED and retrieved for this site on 19 September 2026, together with the agencies' own statements of what each series counts. I hold no government brief, sit inside no firm, and have seen no licence application, no review file and no transaction docket. That position sees flows and it sees output. It does not see a single screening decision. No series in this publication counts transactions reviewed, licences granted or refused, entities added to a list, or investments blocked, and none records the date on which any of those things happened. The consequence is strict and worth stating before any number is read. Nothing below establishes that screening caused a movement in trade. What the record supports is a description of the shape the movement took, and an account of which questions the published statistics are constitutionally unable to answer.
Published 6 minute read

Ilustración: The Cefa Brief
The tension is usually stated as a choice between two settings of the same dial. A country can be open, and accept what openness carries in with it, or it can be closed, and pay for security in growth forgone. Neither setting describes what the statistics show. Total imports of goods and services rose from 3.97 trillion dollars in 2022 to 4.25 trillion in 2025, and total exports rose from 3.04 trillion to 3.32 trillion over the same three years. Across the same three years, two-way goods trade with mainland China fell from 58 billion dollars a month to 35 billion. The dial was not turned. One channel was.
Where this is written from
The vantage decides what the rest of this can claim, so it belongs at the front. I am an analyst writing inside The Cefa Brief, working from published statistics and public documents and from nothing else: annual series redistributed by FRED and retrieved for this site on 19 September 2026, together with the agencies' own statements of what each series counts. I hold no government brief, sit inside no firm, and have seen no licence application, no review file and no transaction docket. That position sees flows and it sees output. It does not see a single screening decision. No series in this publication counts transactions reviewed, licences granted or refused, entities added to a list, or investments blocked, and none records the date on which any of those things happened. The consequence is strict and worth stating before any number is read. Nothing below establishes that screening caused a movement in trade. What the record supports is a description of the shape the movement took, and an account of which questions the published statistics are constitutionally unable to answer.
The aggregate stayed open
Take the openness measure first, because the argument for security screening is usually made against it. Imports of goods and services run 3.42 trillion dollars in 2021, 3.97 in 2022, 3.86 in 2023, 4.11 in 2024 and 4.25 in 2025. Exports run 2.57, 3.04, 3.07, 3.22 and 3.32 trillion across the same five years. Both are annual observations and need no period qualifier. From 2021 to 2025 imports added 0.83 trillion dollars, a rise of 24.3 percent, and exports added 0.75 trillion, a rise of 29.2 percent. The published share of exports in output reads 11 percent. An economy trading at those levels, and growing both legs of the trade, has not been closed by anything.
One channel narrowed at both ends
The bilateral series tell a different story on a different scale. U.S. goods imports from China run 36 billion dollars a month in 2020, 42 in 2021, 45 in 2022, 36 in 2023, 37 in 2024 and 26 in 2025. Exports to mainland China run 10, 13, 13, 12, 12 and 9 a month across the same six years. Each of those is a monthly average, the mean of that year's twelve readings, and not the year's trade. Added together they give the size of the channel: 46 billion dollars a month in 2020, 55 in 2021, 58 in 2022, 48 in 2023, 49 in 2024 and 35 in 2025. From the 2022 high to 2025 the channel lost 23 billion dollars a month, a contraction of 39.7 percent. It now sits 11 below where the window opened, 23.9 percent below the 2020 reading.
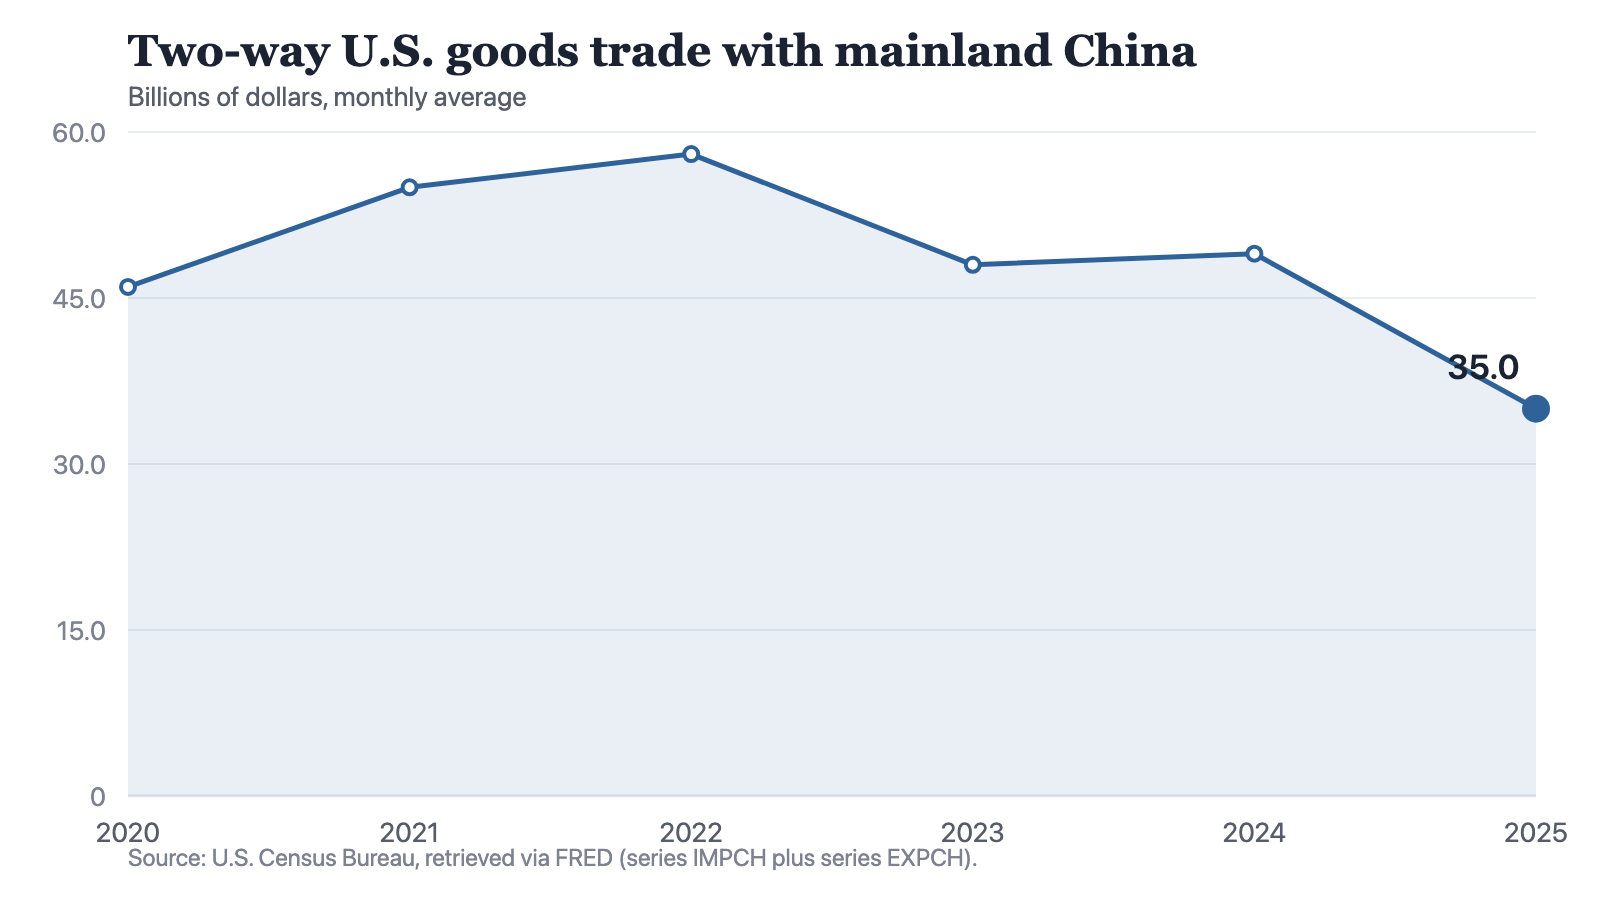
Notes: Series IMPCH plus series EXPCH, U.S. Census Bureau, in billions of dollars at a monthly average. Each point is the average of that year's twelve monthly readings and is not a total for the year. Goods only; the two series carry no services. Origin is as declared at the customs line, so a component made in one country and shipped from another is counted where it was declared.
Source: The Cefa Brief
Chart description
A line chart of two-way goods trade with mainland China, imports and exports summed, at 46 billion dollars a month in 2020, 55 in 2021, 58 in 2022, 48 in 2023, 49 in 2024 and 35 in 2025. The line rises to a high at 2022, falls 10 to 2023, holds within 1 to 2024, and then falls 14 in the last year to its lowest point in the window.
A line chart of two-way goods trade with mainland China, imports and exports summed, at 46 billion dollars a month in 2020, 55 in 2021, 58 in 2022, 48 in 2023, 49 in 2024 and 35 in 2025. The line rises to a high at 2022, falls 10 to 2023, holds within 1 to 2024, and then falls 14 in the last year to its lowest point in the window.
Most accounts of this contraction describe one leg of it. The import leg is the larger one and it moved furthest: down 19 billion dollars a month from 2022 to 2025, or 42.2 percent, with 11 of that 19 arriving in the final year alone. The export leg moved too, and in the same direction: down 4 billion a month from 2022 to 2025, or 30.8 percent, and down 3 in the last year alone, a fall of 25.0 percent from 2024 to 2025. A restriction on what a country will buy is a decision its own government can take. A fall in what that country sells is not, and it lands on domestic exporters, who appear in no series as a group and have no offsetting gain anywhere in the series cited here. Set the legs against each other and the balance inside the channel improved as the channel shrank: exports were 27.8 percent of imports in 2020 and 34.6 percent in 2025, because the larger leg fell faster than the smaller one.
A screen is applied to one transaction. Openness is measured across all of them. No series cited here holds both, which is why the trade-off is always argued and never computed.
The two measures are not on one scale
There is a strong temptation at this point to put the aggregate and the bilateral series on one line and read the difference as the cost of the policy. It cannot be done, and the reason is not fastidiousness. The aggregates are annual totals in trillions of dollars covering goods and services. The bilateral series are monthly averages in billions of dollars covering goods alone. Their levels differ in unit, in coverage and in periodicity, and dividing one by the other produces a number with no referent. Percentage changes survive the mismatch, because a percentage is unit-free, and they are the only quantity compared across the two here: from 2022 to 2025 total imports rose 7.1 percent and total exports rose 9.2 percent, while the bilateral channel fell 39.7 percent. That is the structural fact. An economy can hold its aggregate openness while one relationship inside it contracts by 39.7 percent, and the published statistics will show both at once without ever reconciling them.
The object of the screen is not in the series
Screening is justified by reference to particular goods rather than to trade in general, and semiconductors are the case usually made. Domestic semiconductor production, on a 2017 base of 100, runs 121 in 2021, 131 in 2022, 135 in 2023, 144 in 2024 and 165 in 2025: a gain of 44 index points, or 36.4 percent, with 21 of those points arriving in the final year. Computer and electronic product output, which shares that base and contains semiconductors as one component category, runs 110.3 in 2021 and 126.8 in 2025, a gain of 16.5 points or 15.0 percent. The component has outrun the category holding it. What the indexes will not say is why. They carry no attribution to a subsidy, a screen, a tariff or a commercial decision, no count of chips, no value of output, and no buyer. A case for screening built on these two lines is a case built on a coincidence of dates, and the dates are annual.
How the tension is being resolved in practice
Read together, the series describe a settlement rather than a doctrine. Openness is defended in the aggregate, where it is cheap to defend and easy to measure, and security is pursued channel by channel, where the cost falls on identifiable firms and never reaches a national total. The arrangement is durable for that reason and unaudited for the same one: the instrument credited with the work is the only one here with no published count. What the record will support is narrower than the subject deserves, and the gap between the two is itself the finding. American aggregate trade grew on both legs through 2025. One bilateral channel contracted 39.7 percent from its 2022 high and ended the window below its 2020 level, the fall running in both directions and accelerating in the final year, with the export leg down 30.8 percent and no constituency to speak for it. Domestic semiconductor output rose 36.4 percent over four years and outpaced the wider electronics category it sits inside. Those three statements hold. The sentence everyone wants, which would say how much of any of it a screening regime produced and at what price, is not available from the series cited here and will not become available from them until the decisions themselves are counted and published alongside the flows. Until then the trade-off is settled in practice and argued in the abstract, and a policy claiming the settlement as its achievement is claiming credit the record can neither confirm nor refuse.
How to cite
Jag DeSaint, "Openness and security are being reconciled by narrowing one channel at both ends rather than by closing the economy," The Cefa Brief, Applied America, 24 de septiembre de 2026, https://applied.thecefa.org/cefa-brief/the-screened-channel-has-two-legs.
About the author

Each author told us that for this piece they hold no interest a reader would think relevant.
This Perspectives piece carries its author's name because the view in it is the author's own. An editor reviewed it before publication, which is not the same as agreeing with it. It is not a position of the Center for Economics & Foreign Affairs or of Applied America.
© 2026. The author or authors hold the copyright in this Perspectives piece; CEFA publishes it with their permission. This edition, its editing and its presentation are © 2026 Center for Economics & Foreign Affairs. To republish it, see our republication terms. Republishing
Share
The Cefa Brief · applied.thecefa.org/cefa-brief/the-screened-channel-has-two-legs · Printed from the web edition