
Imports fell once in five years and that fall is the least reliable number in the series
Imports of goods and services dropped from 3.97 to 3.86 trillion dollars in 2023, the only decline in the run. Producer prices fell that same year, which means the one movement most often read as evidence of reshoring is the one that can least bear the reading.
by
Published 4 minute read

Ilustración: The Cefa Brief
Imports of goods and services ran at 3.42 trillion dollars in 2021, 3.97 in 2022, 3.86 in 2023, 4.11 in 2024 and 4.25 in 2025. Four of those five observations are increases. One is a decline, and that decline is the one that gets quoted.
It is the only point in the series that appears to show the country buying less from abroad, and it is asked to carry a great deal of weight in arguments about whether supply chains are moving home. It cannot carry it. The reason is not that the figure is wrong but that it is denominated in a unit which moved underneath it.
A current-dollar series has two things inside it
This series is in current dollars. That means every reading is a quantity multiplied by a price, and a fall of 0.11 trillion between 2022 and 2023 is consistent with fewer goods arriving, with the same goods arriving cheaper, or with more goods arriving considerably cheaper. The three have entirely different policy implications and the series does not distinguish between them.
Start with its size. The fall is 0.11 trillion dollars against a 2022 level of 3.97, which is under three percent. The rise it interrupted, from 3.42 to 3.97 in 2022, was 0.55 trillion — five times as large, in the opposite direction, one year earlier. A series that adds half a trillion dollars in one year and gives back a fifth of that in the next has not changed course. It has wobbled, in a unit that wobbles.
There is a reason to take the price explanation seriously in this particular year. The producer price index for all commodities in this dataset runs 194.4, 227.3, 264.5, 255.7, 254.6, 260.3 across 2020 to 2025. It rose sharply into 2022 and then fell, from 264.5 to 255.7, in the same year imports fell. That is a domestic index and not an index of import prices — I want to be exact about that — but it establishes that 2023 was a year in which goods prices generally came off a peak. A nominal import decline in such a year is precisely the kind of number that should not be converted into a claim about volumes.
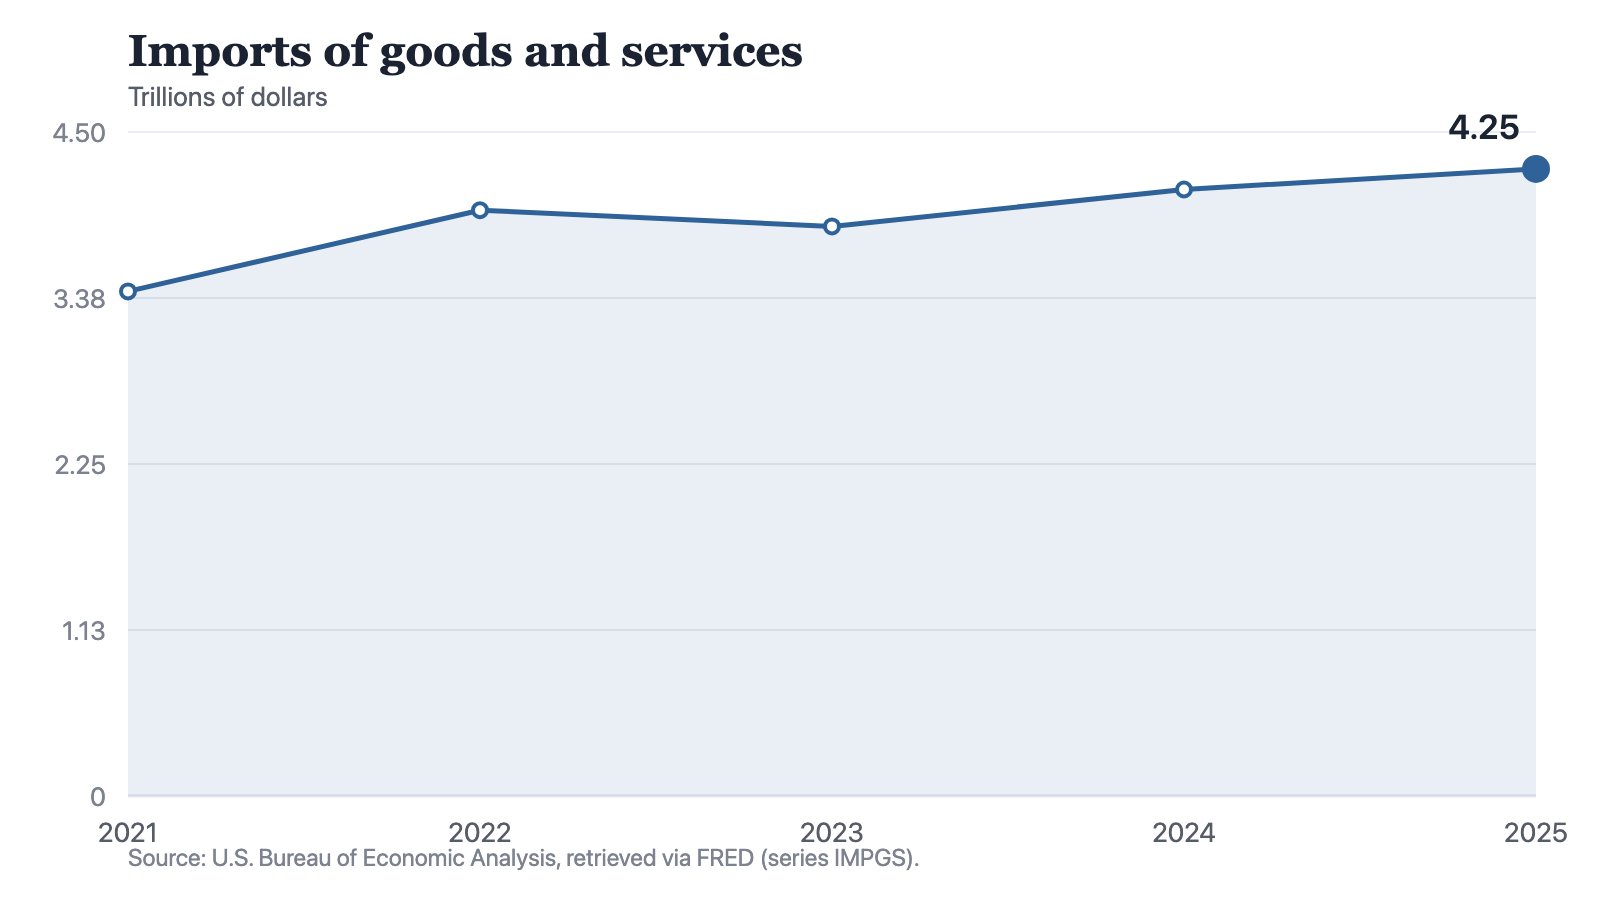
Notes: Current dollars. Services are included in the total. Source: U.S. Bureau of Economic Analysis, retrieved via FRED (series IMPGS). Retrieved 19 September 2026.
Source: The Cefa Brief
Chart description
The line rises from 3.42 trillion dollars in 2021 to 3.97 in 2022, falls to 3.86 in 2023, then rises again to 4.11 in 2024 and 4.25 in 2025. The single fall of 0.11 trillion in 2023 is the only decline in the five observations, and the 2025 reading is the highest in the series.
The line rises from 3.42 trillion dollars in 2021 to 3.97 in 2022, falls to 3.86 in 2023, then rises again to 4.11 in 2024 and 4.25 in 2025. The single fall of 0.11 trillion in 2023 is the only decline in the five observations, and the 2025 reading is the highest in the series.
What happened either side of it
The years around the dip settle the question of whether it marked a turn. Imports set a new high in 2024 at 4.11 and again in 2025 at 4.25. The 2025 figure is the largest in the series and exceeds the pre-dip 2022 level by 0.28 trillion. Across the five observations the series has added 0.83 trillion, and it did so with one interruption.
The consumer price index over the same window went 292.6 in 2022, 304.7 in 2023, 313.7 in 2024, 322 in 2025, and current-dollar output rose from 26.1 trillion to 30.8 trillion between 2022 and 2025. An import bill that grows in current dollars alongside a price level and an economy that are also growing in current dollars is not, by itself, evidence of anything at all. That is the uncomfortable symmetry: the rises are as ambiguous as the fall.
The honest sentence is that imports in current dollars have gone up. Everything anyone actually wants to know sits underneath that sentence, in a series this dataset does not hold.
What would settle it, and what this file has instead
Settling it would take a deflated import series, or an import price index, or commodity and country detail showing what changed composition. None of the three is here. This dataset carries an annual national total and nothing beneath it: no country of origin, no commodity class, no port, no monthly path that would show when in 2023 the fall occurred.
There is a practical version of this for anyone who has to use the figure. If a claim about imports would survive being restated as "the current-dollar import bill moved by this much", it is probably safe. If it only works when restated as "this much less arrived at the docks", it is not supported by anything on this page. That test costs nothing and disqualifies most of what the 2023 observation has been asked to prove.
That absence is worth naming rather than working around, because the temptation runs the other way. A single annual total is the easiest number in the world to build a story on, precisely because there is nothing inside it to contradict you. The 2023 dip can be read as reshoring, as demand weakness, as inventory correction or as a tariff effect, and this series supports all four equally, which is to say it supports none of them.
The defensible reading is short. Imports of goods and services are higher than at any point in the five years this site holds, they have risen in four observations out of five, and the single exception falls in a year when goods prices were also falling. Anyone using that exception as the foundation of an argument about industrial policy is building on the weakest observation in the series.
Method and data
Imports here are the series IMPGS from the U.S. Bureau of Economic Analysis, redistributed by FRED and retrieved for this site on 19 September 2026. The series title is Imports of goods and services: services are inside these totals, not additional to them. The figures are annual and in trillions of current dollars.
Current dollars is the whole of the point. A current-dollar series moves when prices move and when quantities move, and this site holds no deflated import series and no import price index. Nothing here separates the two, and no figure in this piece should be read as a volume.
The producer price index for all commodities, series PPIACO, measures prices received by domestic producers. It is not an index of import prices and is not a substitute for one. It appears here to establish that 2023 was a year of falling goods prices in general, which is enough to make a nominal decline ambiguous and nowhere near enough to quantify the ambiguity.
Consumer prices are series CPIAUCSL and current-dollar GDP is series GDP, both annual, both retrieved on the same date. The imports series on this site begins at 2021, so there are five observations and no pre-2021 comparison is possible from these files.
There is no commodity, country or port detail in this dataset, so nothing here identifies what was imported or from where.
Data sources
- U.S. Bureau of Economic Analysis, imports of goods and services (series IMPGS), retrieved via FRED (sitio externo)
- U.S. Bureau of Labor Statistics, producer price index, all commodities (series PPIACO), retrieved via FRED (sitio externo)
- U.S. Bureau of Labor Statistics, consumer price index for all urban consumers (series CPIAUCSL), retrieved via FRED (sitio externo)
- U.S. Bureau of Economic Analysis, gross domestic product (series GDP), retrieved via FRED (sitio externo)
How to cite
Jag DeSaint, "Imports fell once in five years and that fall is the least reliable number in the series," The Cefa Brief, Applied America, 30 de septiembre de 2026, https://applied.thecefa.org/cefa-brief/the-one-year-imports-fell.
About the author

Each author told us that for this piece they hold no interest a reader would think relevant.
This Insights piece carries its author's name because the view in it is the author's own. An editor reviewed it before publication, which is not the same as agreeing with it. It is not a position of the Center for Economics & Foreign Affairs or of Applied America.
© 2026. The author or authors hold the copyright in this Insights piece; CEFA publishes it with their permission. This edition, its editing and its presentation are © 2026 Center for Economics & Foreign Affairs. To republish it, see our republication terms. Republishing
Share
The Cefa Brief · applied.thecefa.org/cefa-brief/the-one-year-imports-fell · Printed from the web edition