
ExplicativoStates & Communities
How state gross domestic product is measured and why the largest states dominate
State GDP counts what is produced inside a state's borders in a single year, valued at that year's prices. By the end you will know what the ranking does and does not tell you about the people who live there.
Prepared by
Last reviewed Published 3 minute read

Ilustración: The Cefa Brief
Gross domestic product by state is the Bureau of Economic Analysis's measure of the value added by every industry operating inside a state's borders during a year. Value added is what an industry sells minus what it buys from other industries in order to make it. Adding value added rather than sales is what keeps the same steel from being counted twice, once when the mill sells it and again when it leaves a plant as a car.
The measure is anchored to the place of production. Output is credited to the state where the work happens, not to the state where the company is headquartered, where its shareholders live, or where the buyer takes delivery. A refinery in Louisiana adds to Louisiana's total whether its owner sits in Houston or in Rotterdam. That single convention explains most of what people find surprising about the table.
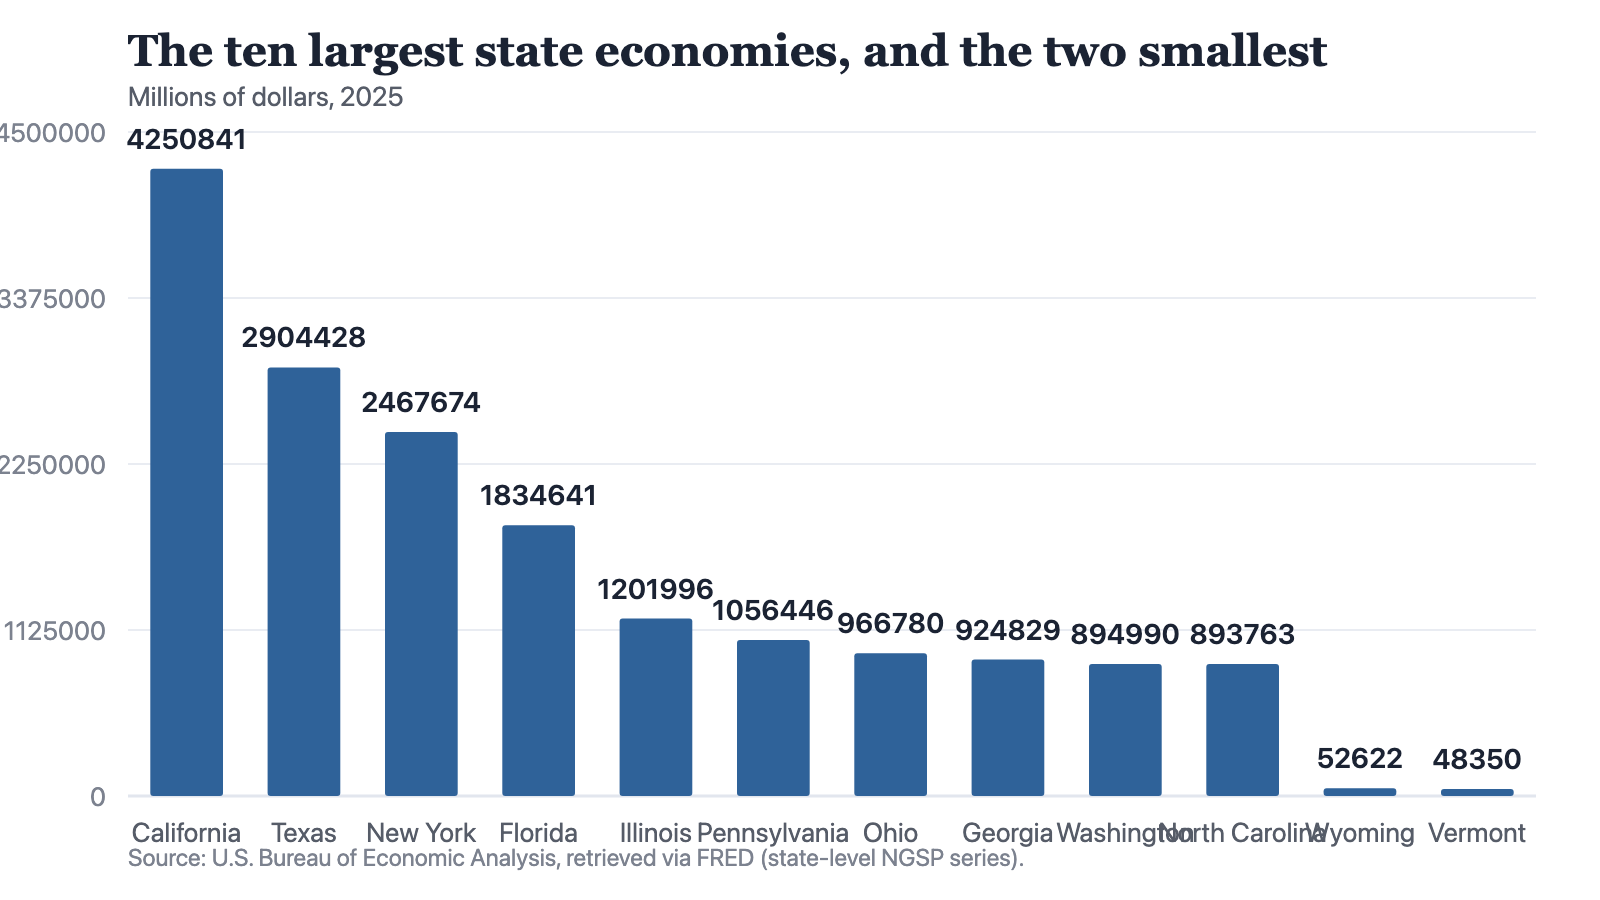
Notes: Source: U.S. Bureau of Economic Analysis, retrieved via FRED (state-level NGSP series). Current-dollar figures are valued at 2025 prices and are not adjusted for differences in the cost of living between states.
Source: The Cefa Brief
Chart description
Twelve bars, ordered from largest to smallest. California is the longest at 4,250,840.8 million dollars. Texas follows at 2,904,427.8, then New York at 2,467,674, then Florida at 1,834,641.4. Six states form a close cluster below that, running from Illinois at 1,201,996.1 down through Pennsylvania, Ohio, Georgia and Washington to North Carolina at 893,762.5, so their bars are nearly the same length as one another. The last two bars belong to Wyoming at 52,622.3 and Vermont at 48,350.3; set beside California's bar they are slivers.
Twelve bars, ordered from largest to smallest. California is the longest at 4,250,840.8 million dollars. Texas follows at 2,904,427.8, then New York at 2,467,674, then Florida at 1,834,641.4. Six states form a close cluster below that, running from Illinois at 1,201,996.1 down through Pennsylvania, Ohio, Georgia and Washington to North Carolina at 893,762.5, so their bars are nearly the same length as one another. The last two bars belong to Wyoming at 52,622.3 and Vermont at 48,350.3; set beside California's bar they are slivers.
Why the ranking is so lopsided
State GDP is a level, not a rate. It scales with how many people work in a state, how much capital they work with, and how dear the year's output was. Large populations therefore sit at the top of the table more or less automatically, and the order of the table changes slowly, because the things that determine it change slowly.
That makes the ranking a poor instrument for most of the questions put to it. A state near the top is not thereby productive, prosperous or well governed. It is large. A state near the bottom is not failing. It is small. Those are different claims and they need different statistics: output per worker for productivity, income per resident for prosperity, a growth rate for momentum.
The ranking answers a question about size. Most people reaching for it want an answer about prosperity.
Prices are inside the number
The series charted here is in current dollars, which means each year is valued at that year's prices. When a state's current-dollar GDP rises, part of the rise is more output and part is dearer output, and the figure on its own will not separate them. The Bureau of Economic Analysis also publishes a chained-dollar series that strips price change out. Anyone comparing one year with another should know which of the two is on the page, because over a stretch of high inflation the two tell noticeably different stories.
- It does not measure income received by residents. Wages, profits and rent earned inside a state can be paid to people who live somewhere else.
- It does not adjust for the cost of living, so a dollar of output in one state does not buy what a dollar of output buys in another.
- It does not settle where the output of a firm operating in several states belongs. The Bureau allocates using payroll and other reported data, and that allocation is an estimate rather than an observation.
Where economists disagree
There is no serious dispute about how the measure is built. There is a real dispute about what to do with it. One camp argues that levels are the right frame for questions of national capacity: where the industrial base physically sits matters for supply chains, for procurement and for defence, whatever the per-head performance of the state that hosts it. Another argues that a ranking by level mostly restates the census, and that per-head or per-worker figures are the only honest basis for comparing one state with another. Both positions are held by careful people. The choice between them is usually driven by the question being asked rather than by anything in the statistic.
A test you can apply. When a state GDP figure turns up inside an argument, ask what would happen to the argument if every state had the same population. If the claim survives that thought experiment, it is a claim about an economy. If it collapses, it was a claim about size wearing economic clothes.
About the author
Each author told us that for this piece they hold no interest a reader would think relevant.
Explainers are written and kept up to date by The Cefa Brief’s editors. An Explainer is background CEFA stands behind. It is not one author’s argument, and it is not a CEFA position on what anyone should do. If something here is wrong or out of date, write to applied@thecefa.org.
© 2025 Center for Economics & Foreign Affairs. To republish it, see our republication terms. Republishing
Share
The Cefa Brief · applied.thecefa.org/cefa-brief/state-gross-domestic-product · Printed from the web edition