
American payrolls keep growing, and each year adds less than the one before
Total nonfarm payrolls rose in every annual reading from 2020 to 2025. The size of the rise has fallen three years running, from 6.2 million jobs to 700,000.
by
Published 3 minute read

Ilustración: The Cefa Brief
There is a version of the American labour market that is described entirely in the direction of travel. Payrolls are up. Hiring continues. Nothing in the record contradicts either statement. But the series has a second property that the direction alone conceals, and it is the more useful one: the annual addition has got smaller in each of the last three readings, and the most recent addition is the smallest in the window.
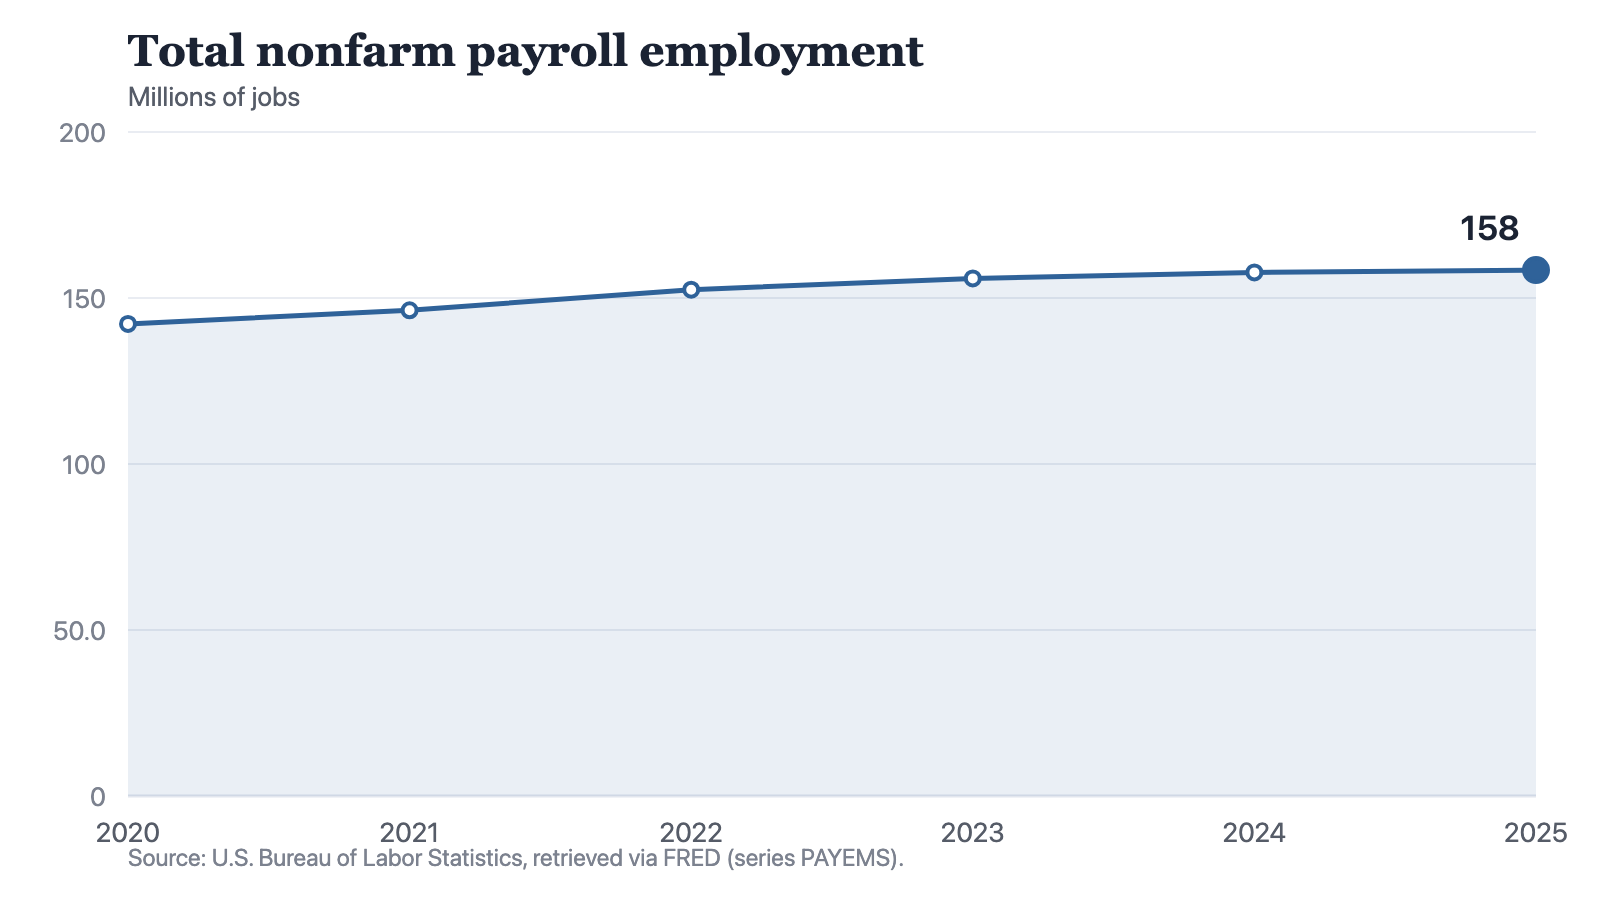
The six annual observations run 142.2 million jobs in 2020, 146.3 in 2021, 152.5 in 2022, 155.9 in 2023, 157.7 in 2024 and 158.4 in 2025. Across the whole span the count rose by 16.2 million. That is the headline, and it is true.
The shape of the increase
Take the differences between consecutive readings and the picture changes character. The 2021 observation is 4.1 million above 2020. The 2022 observation is 6.2 million above 2021. Then 3.4 million, then 1.8 million, then 0.7 million. Five increments, and after the second one they only get smaller.
Notes: Annual observations. The count is of payroll jobs rather than of people, so someone holding two jobs is counted twice; the self-employed and farm workers are outside it.
Source: The Cefa Brief
Chart description
A line chart of total nonfarm payroll employment in millions of jobs. The line rises from 142.2 in 2020 to 146.3 in 2021 and 152.5 in 2022, then climbs more gently to 155.9 in 2023, 157.7 in 2024 and 158.4 in 2025. The steep early section and the nearly flat final section are the visible features.
A line chart of total nonfarm payroll employment in millions of jobs. The line rises from 142.2 in 2020 to 146.3 in 2021 and 152.5 in 2022, then climbs more gently to 155.9 in 2023, 157.7 in 2024 and 158.4 in 2025. The steep early section and the nearly flat final section are the visible features.
The first two increments deserve a caution before anything is built on them. The 2020 reading is the low point of the window, and a great deal of the 2021 and 2022 movement is the count returning to a level it had already held rather than reaching a level it had not. Recovery and expansion produce the same arithmetic sign and mean quite different things. Treating the 4.1 and the 6.2 as evidence of underlying hiring strength reads a rebound as an achievement.
What is left after that caution is the last three increments, and they are the part of the record that is genuinely new ground: 3.4 million, then 1.8 million, then 0.7 million. Each is roughly half its predecessor. The 2025 addition is about a ninth of the 2022 addition.
That is the finding. Not that hiring stopped, because it did not, and not that the level fell, because it never has in this window. The finding is that the rate at which the payroll count is being added to has compressed for three consecutive observations, and that the most recent observation is the smallest step in the series.
What this series does not settle
A count of payroll jobs is not a count of working people, and the difference matters more as the count flattens. Someone who takes a second job adds to this series without any new person entering work. Someone who leaves payroll employment for self-employment subtracts from it without leaving work. When annual movement was measured in millions, that ambiguity was small relative to the signal. At 700,000 it is not obviously small at all.
These are also annual observations, and they carry no information about the path inside a year. A year that added 700,000 jobs steadily and a year that added them in one quarter and stalled in three produce the same point on this chart. Nothing here distinguishes the two, and no honest reading of it should pretend otherwise.
Nor does the series carry any explanation. It does not say whether the smaller increments reflect employers who have stopped hiring, or employers who cannot find people to hire, or a labour force that has stopped growing fast enough to supply them. Those are different conditions with different remedies, and this line is compatible with all of them.
Reading the last increment
For anyone planning around American labour supply, and that includes every industrial programme currently justified by job creation, 0.7 million is the number to sit with. It is what the national payroll count added in its most recent annual observation, against a base of 157.7 million. A project that assumes it can staff itself out of a rapidly growing national pool is assuming a condition that the most recent reading of this series does not describe.
The direction is still up. But a line that is rising and flattening is a different planning environment from a line that is rising and steep, and the distinction is invisible to anyone reading only the first derivative's sign. The series says jobs were added. It also says, three years in a row now, that fewer of them were added than the year before.
Method and data
The figures are annual observations of total nonfarm payroll employment, published by the U.S. Bureau of Labor Statistics and redistributed by FRED, retrieved for this site on 19 September 2026. They are stated in millions of jobs.
The annual increases quoted here are differences between consecutive observations in that series, and nothing more. They are not seasonally adjusted month-to-month changes, not quarterly figures, and not a growth rate.
The series counts jobs on employer payrolls, not people. A person holding two payroll jobs appears twice. It excludes the self-employed, unpaid family workers, private household workers and farm employment. A rise in this count is therefore not the same as a rise in the number of people working.
How to cite
Jag DeSaint, "American payrolls keep growing, and each year adds less than the one before," The Cefa Brief, Applied America, 3 de febrero de 2025, https://applied.thecefa.org/cefa-brief/payroll-growth-shrinking-every-year.
About the author

Each author told us that for this piece they hold no interest a reader would think relevant.
This Insights piece carries its author's name because the view in it is the author's own. An editor reviewed it before publication, which is not the same as agreeing with it. It is not a position of the Center for Economics & Foreign Affairs or of Applied America.
© 2025. The author or authors hold the copyright in this Insights piece; CEFA publishes it with their permission. This edition, its editing and its presentation are © 2025 Center for Economics & Foreign Affairs. To republish it, see our republication terms. Republishing
Share
The Cefa Brief · applied.thecefa.org/cefa-brief/payroll-growth-shrinking-every-year · Printed from the web edition