
ExplicativoStates & Communities
Personal income per head and the median wage measure different things
One is a mean taken over everybody, the other a middle taken over jobholders. By the end you will know why a state can look rich on one and ordinary on the other, and which question each figure answers.
Prepared by
Last reviewed Published 3 minute read

Ilustración: The Cefa Brief
Two figures are routinely offered as the income of a state, and they are not the same figure. Per-capita personal income comes from the Bureau of Economic Analysis. The median annual wage comes from the Bureau of Labor Statistics. They differ in what they count, in whom they count, and in how they summarise a distribution. Each of those three differences pushes them apart, and all three push in the same direction.
Personal income is everything residents receive: wages and salaries, but also proprietors' income, rent, dividends, interest, and transfer payments such as Social Security and Medicare benefits. That total is divided by the state's whole population, children and retirees included. It is a mean. The median wage is the middle of the distribution of annual wages among people who hold a wage job, estimated from a survey of the establishments that employ them.
Notes: Source: U.S. Bureau of Labor Statistics, Occupational Employment and Wage Statistics, 2025. The survey covers wage and salary employment at establishments, so the self-employed are outside it. Figures are not adjusted for the cost of living.
Source: The Cefa Brief
Chart description
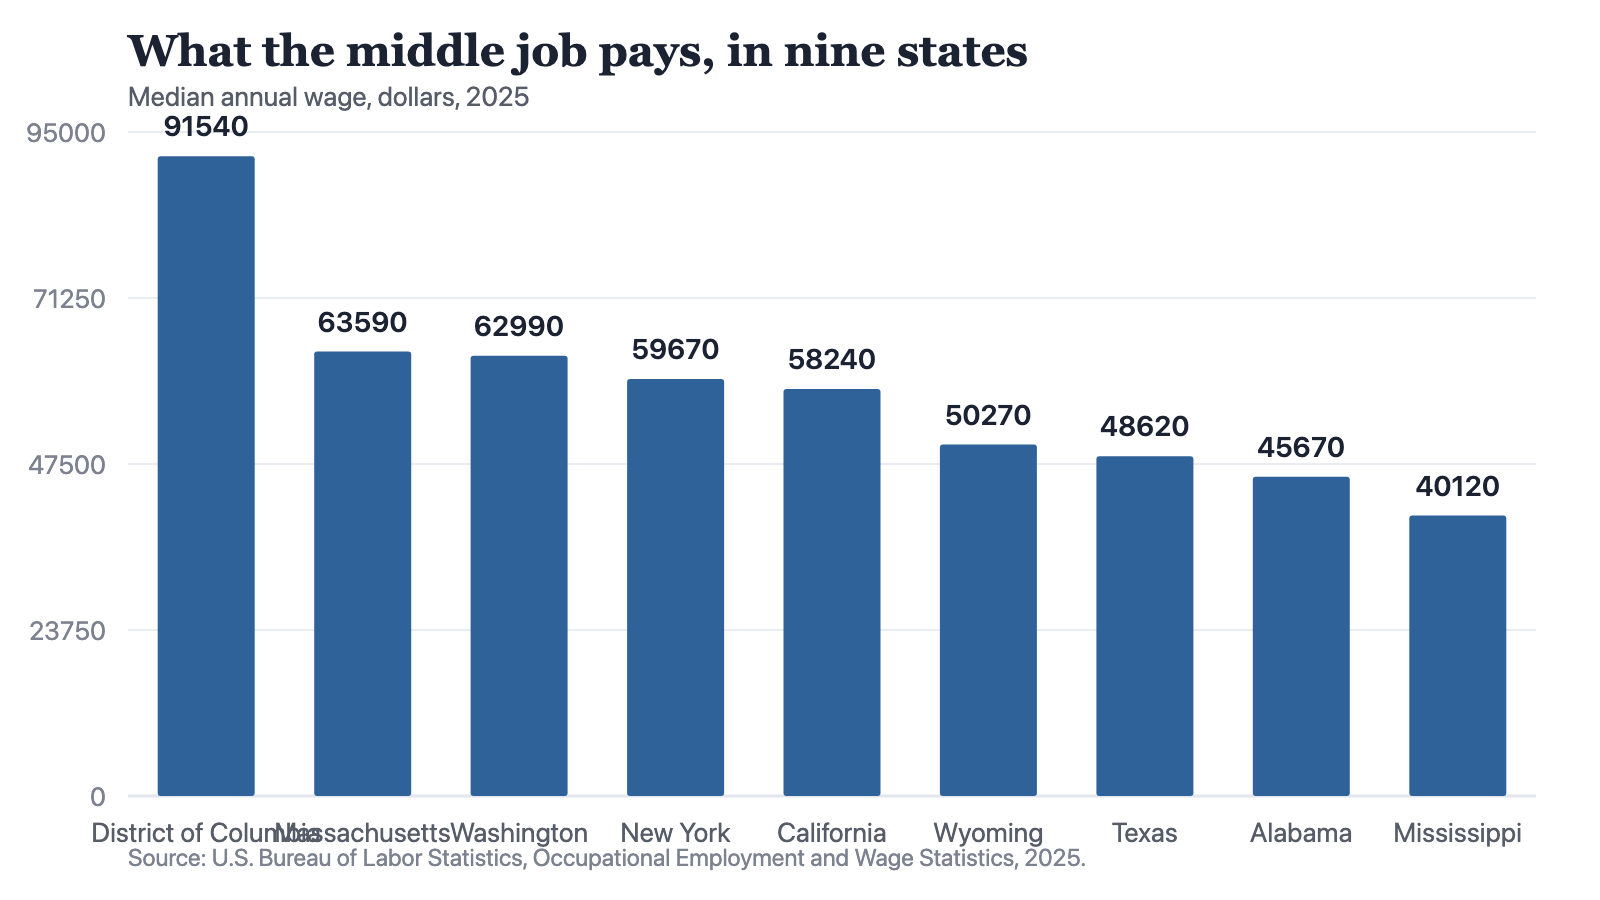
Nine bars, ordered from highest to lowest. The District of Columbia stands alone at the top at 91,540 dollars, well clear of everything below it. Then comes a tight group whose bars are nearly the same length: Massachusetts at 63,590, Washington at 62,990, New York at 59,670 and California at 58,240. A lower group follows, again closely spaced, with Wyoming at 50,270, Texas at 48,620 and Alabama at 45,670. Mississippi closes the chart at 40,120. The shape is one tall outlier and then a smooth staircase, with no large step between any two of the remaining eight.
Nine bars, ordered from highest to lowest. The District of Columbia stands alone at the top at 91,540 dollars, well clear of everything below it. Then comes a tight group whose bars are nearly the same length: Massachusetts at 63,590, Washington at 62,990, New York at 59,670 and California at 58,240. A lower group follows, again closely spaced, with Wyoming at 50,270, Texas at 48,620 and Alabama at 45,670. Mississippi closes the chart at 40,120. The shape is one tall outlier and then a smooth staircase, with no large step between any two of the remaining eight.
Three differences, all in one direction
- The numerator differs. Personal income includes property income and government transfers. The wage figure includes neither.
- The denominator differs. Income per head divides by every resident. The median wage describes only people who hold a wage job.
- The summary differs. A mean is pulled upward by the top of a distribution. A median is not.
In every state the two figures sit far apart, and the distance is not an error in either of them. It is the arithmetic consequence of those three choices. Wyoming makes the point sharply. Its median wage sits in the lower half of the chart, below Washington's and below California's. Its per-capita personal income is higher than Washington's. Mineral royalties, other property income and a distribution with a heavy top account for the difference. A typical Wyoming paycheque does not.
The District of Columbia shows a second mechanism at work. Its median wage is the highest on the chart and its per-capita personal income is higher still. But the wage figure describes jobs located in the District, a large share of them filled by people who live in Maryland or Virginia, while the income figure describes the District's own residents. The two numbers are not drawn from the same population at all, and no amount of care in either survey would bring them together.
A mean over everybody and a middle over jobholders will never agree, and neither of them is wrong.
What each one is good for
Per-capita personal income is the better measure of the total resources flowing to the people of a state. That is what you want when the question is fiscal capacity, or the size of a consumer market, or how hard a cut in transfer payments would bite. The median wage is the better measure of what work pays. That is what you want when the question is whether a plant, a warehouse or a research campus would raise or lower the standard of a normal job in the county that hosts it. Using one to answer the other's question is the common error, and it is almost always made in the direction that flatters the argument.
Where economists disagree
The disagreement is not about which figure is accurate. Both are. It is about which one describes welfare. One position holds that means are the honest measure of a state's economic resources, since property income and transfers are real money reaching real households, and leaving them out understates what people actually have. The other holds that a mean taken over a skewed distribution describes nobody in particular, that the typical household is better captured by a median, and that presenting mean income as what people earn has misled a generation of regional policy. There is a narrower technical dispute alongside it: the wage survey covers employment at establishments, so the self-employed and independent contractors fall outside it, and views differ on how much that gap now matters.
A test you can apply. When a figure is described as average income, ask three questions before you use it. Who is in the denominator, jobholders or every resident including children? What counts as income, wages only or also rent, dividends and benefits? And is it a mean or a median? A figure that survives those three questions can be argued about. One that does not should not be in the argument.
About the author
Each author told us that for this piece they hold no interest a reader would think relevant.
Explainers are written and kept up to date by The Cefa Brief’s editors. An Explainer is background CEFA stands behind. It is not one author’s argument, and it is not a CEFA position on what anyone should do. If something here is wrong or out of date, write to applied@thecefa.org.
© 2026 Center for Economics & Foreign Affairs. To republish it, see our republication terms. Republishing
Share
The Cefa Brief · applied.thecefa.org/cefa-brief/income-per-head-and-median-wage · Printed from the web edition