
Why agricultural export values move when the harvest does not
An export figure is a price multiplied by a quantity, reported as a single number. Reading it as a measure of how much food left the country confuses the two, and this explains what it takes to tell them apart.
Prepared by
Last reviewed Published 3 minute read

Ilustración: The Cefa Brief
An export figure is a value. It is the quantity that crossed the border multiplied by the price it fetched, added up across commodities. Both terms move, often in opposite directions, and the published figure reports only their product. A year in which more grain was shipped at a lower price and a year in which less grain was shipped at a higher price can produce the same number.
Agricultural commodities make this sharper than most trade categories. Soybeans, corn, wheat and cotton are priced on world exchanges, and those prices turn on weather in other hemispheres, on freight rates and on the dollar. An American farm can have its best harvest on record in a year when the value of what it exports falls, because a good harvest somewhere else pushed the price down.
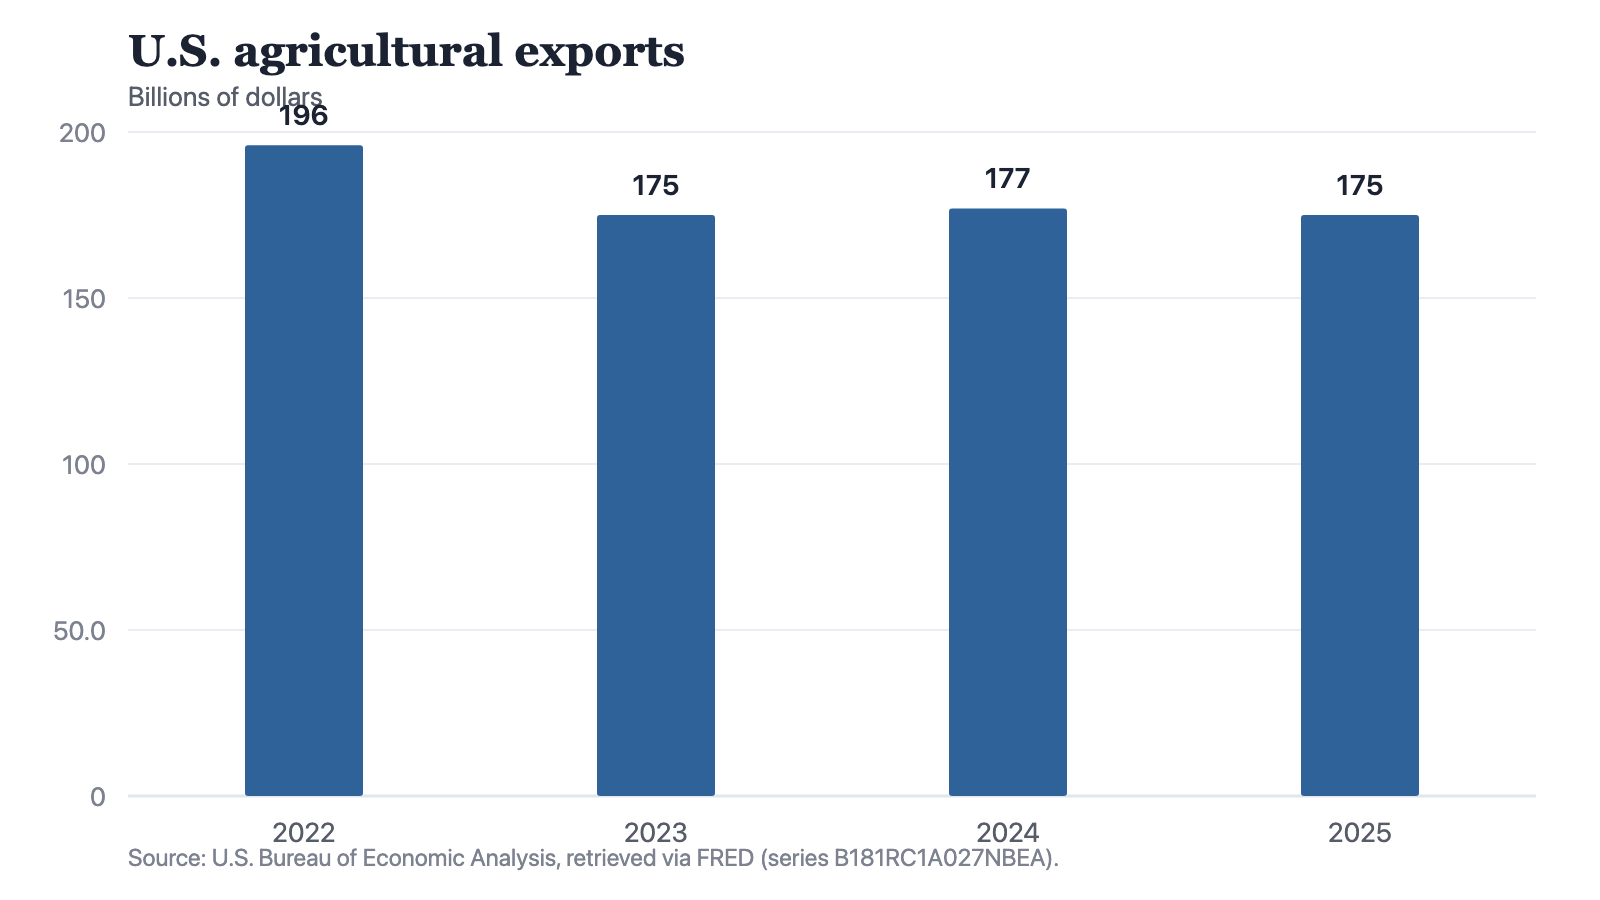
Notes: Source: U.S. Bureau of Economic Analysis, retrieved via FRED (series B181RC1A027NBEA). The series reports value, which is quantity multiplied by price; it is not a measure of the quantity shipped.
Source: The Cefa Brief
Chart description
Four bars, one for each year from 2022 to 2025. The first, 2022, is the tallest at 196 billion dollars. The second drops sharply to 175 billion in 2023, and that single step down is the one large move in the chart. The third edges up to 177 billion in 2024, and the fourth returns to 175 billion in 2025. The shape is one step down followed by a flat run: the last three bars are close enough in height to read as a plateau, sitting well below the first.
Four bars, one for each year from 2022 to 2025. The first, 2022, is the tallest at 196 billion dollars. The second drops sharply to 175 billion in 2023, and that single step down is the one large move in the chart. The third edges up to 177 billion in 2024, and the fourth returns to 175 billion in 2025. The shape is one step down followed by a flat run: the last three bars are close enough in height to read as a plateau, sitting well below the first.
Value, volume and the distance between them
The Department of Agriculture publishes volume series alongside value series for exactly this reason. Tonnes shipped answer a question about production and market access. Dollars earned answer a question about farm income. Neither substitutes for the other. When a fall in export value is offered as evidence that a market has been lost, the volume series is the one that would settle it, and it is rarely the one quoted.
Gross, not net, and first destination, not final
Two further limits are built into any export figure. It is gross: it counts what left and says nothing about what came in, so a country can be a large agricultural exporter and a large agricultural importer in the same year, in different commodities. And trade statistics record the country of first destination, not the country where the goods are eventually eaten or crushed. Cargo that clears a port and then moves on is credited to that port. Bilateral figures for commodities that travel through trading hubs are therefore weaker evidence about where the demand sits than they look.
The classification boundary is a third limit, and it is the one that produces two official figures for the same year. What counts as agricultural is drawn differently by different agencies. The Bureau of Economic Analysis sorts goods trade into the end-use categories it needs for the national accounts. The Department of Agriculture sorts by commodity, with its own treatment of processed foods, ethanol, hides and forestry products. Totals built on different boundaries are not interchangeable, and a gap between two published figures is usually definitional rather than a sign that one of them is wrong.
What the measure is good for
- Farm-sector revenue earned abroad, stated in the dollars of the year in question. That is what the series is, and it has no rival for the purpose.
- Direction over several years, once a volume series has been read alongside it.
- The scale of exposure to a trade disruption or a retaliatory tariff, since the value at risk is the value being earned.
What it cannot do is stand in for the harvest, for acres planted, or for a country's standing as a supplier. Each of those has its own series, and none of them is a price multiplied by a quantity. A falling export value tells you that less money came in. It takes a second series to say whether less food went out.
A falling export value tells you less money came in. It does not tell you less food went out.
So there is a check for any claim built on an export value. Ask whether the claim is about money or about goods. If it is about money, meaning farm income, the trade balance or exposure to a tariff, the value series is the right one and the argument can rest on it. If it is about goods, meaning whether a market has been lost or a competitor has displaced a supplier, the value series can only raise the question and the volume series has to answer it. A claim that travels from one to the other without changing series has not been checked.
About the author
Each author told us that for this piece they hold no interest a reader would think relevant.
Explainers are written and kept up to date by The Cefa Brief’s editors. An Explainer is background CEFA stands behind. It is not one author’s argument, and it is not a CEFA position on what anyone should do. If something here is wrong or out of date, write to applied@thecefa.org.
© 2026 Center for Economics & Foreign Affairs. To republish it, see our republication terms. Republishing
Share
The Cefa Brief · applied.thecefa.org/cefa-brief/agricultural-export-values · Printed from the web edition