
The ten-year yield has risen in every year since 2020
Six annual observations, five changes, and not one of them negative. In the year the overnight policy rate fell 0.93 points, the ten-year rose again.
by
Published 3 minute read

Abbildung: The Cefa Brief
There is a simple thing to notice about the ten-year Treasury yield across the last six annual observations, and almost nobody says it out loud: it has not gone down. Not once. Five changes, five increases.
The series runs 0.89 percent in 2020, 1.45 in 2021, 2.95 in 2022, 3.96 in 2023, 4.21 in 2024 and 4.29 in 2025. From the first observation to the last is a rise of 3.40 percentage points, and every step contributed to it.
A rise that changed speed but never direction
The steps are wildly unequal. The largest is 1.50 points, from 2021 to 2022. The next is 1.01 points, to 2023. After that the series nearly stops moving: 0.25 points to 2024, then 0.08 points to 2025. About nine tenths of the total rise was already in place by the 2023 observation.
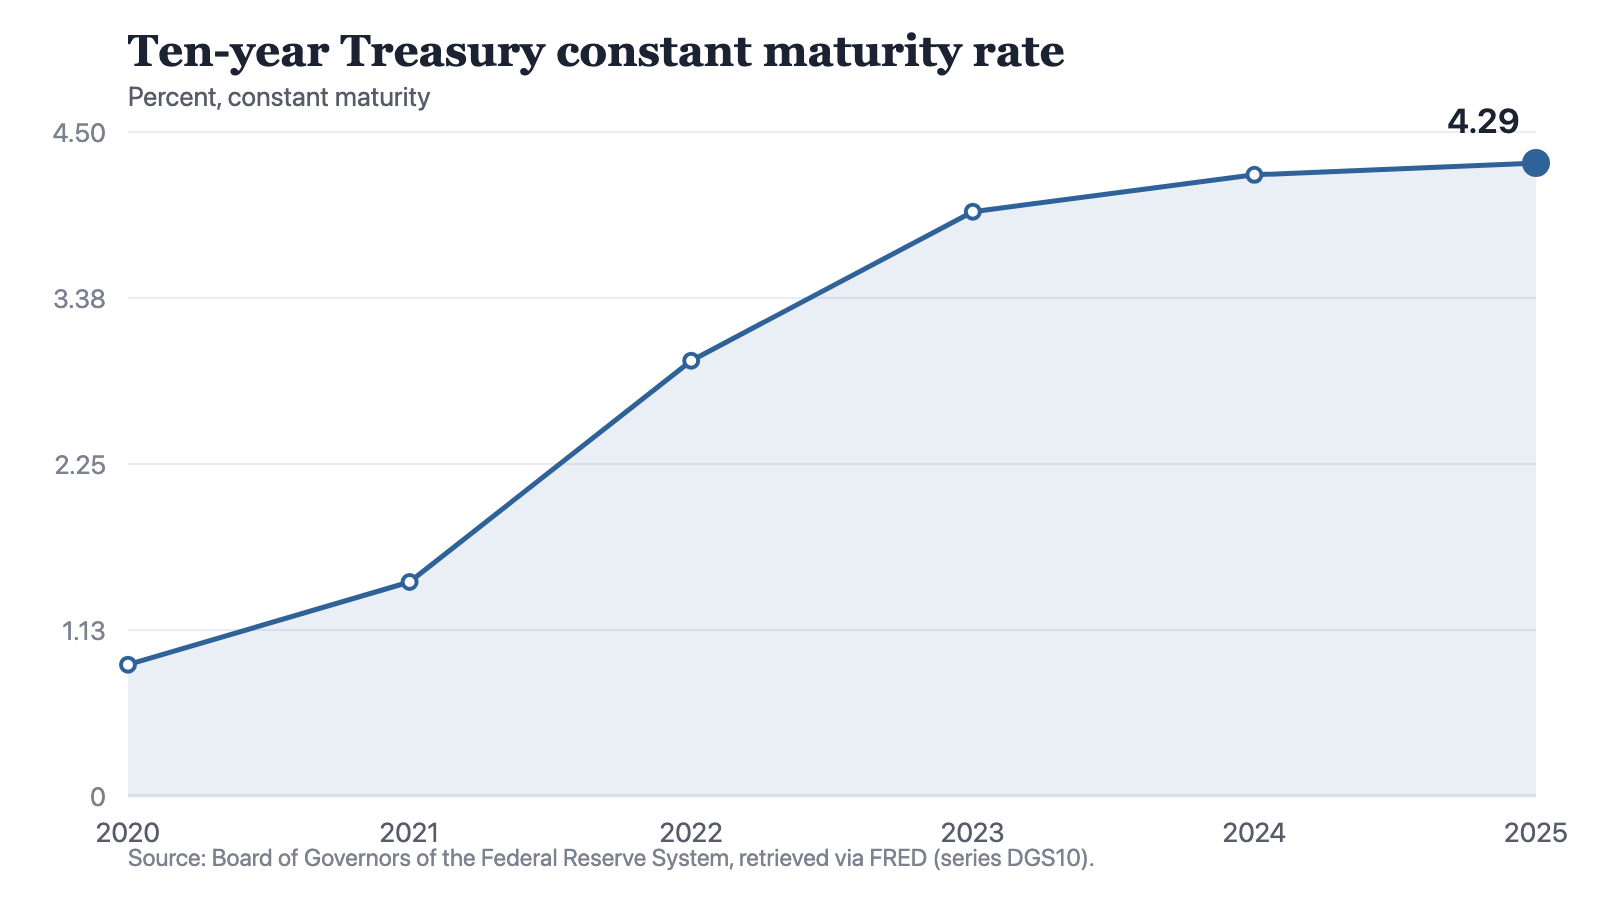
Notes: A constant maturity rate is interpolated to a fixed ten-year horizon from the Treasury yield curve. It is not the coupon on any particular bond. The 2025 observation averages the periods available at retrieval.
Source: The Cefa Brief
Chart description
A line chart showing the ten-year Treasury constant maturity rate rising at every observation: 0.89 percent in 2020, 1.45 in 2021, 2.95 in 2022, 3.96 in 2023, 4.21 in 2024 and 4.29 in 2025. The slope is steepest between 2021 and 2023 and nearly flat across the last two observations. No segment of the line slopes downward.
A line chart showing the ten-year Treasury constant maturity rate rising at every observation: 0.89 percent in 2020, 1.45 in 2021, 2.95 in 2022, 3.96 in 2023, 4.21 in 2024 and 4.29 in 2025. The slope is steepest between 2021 and 2023 and nearly flat across the last two observations. No segment of the line slopes downward.
So the recent story is not a fall. It is a flattening at a high level. The last two changes together add 0.33 points, which is less than a quarter of the single move from 2021 to 2022. The long end stopped climbing quickly. It did not turn around.
There is another way to say the same thing. The last three observations are 3.96, 4.21 and 4.29 percent, a band 0.33 points wide. For three consecutive years the ten-year has sat within a third of a point of where it sits now. The move that mattered finished before that band opened, and what has happened since is the long end holding its new level rather than testing a lower one.
The year the two rates parted company
The most instructive observation is the last one. Between 2024 and 2025 the federal funds effective rate fell from an annual average of 5.14 percent to 4.21 percent, a drop of 0.93 points. Over the same two observations the ten-year rose from 4.21 percent to 4.29 percent.
On these annual averages the ten-year sat below the overnight rate in 2023, 3.96 against 5.02, and again in 2024, 4.21 against 5.14. In 2025 it sat above it, 4.29 against 4.21. The relationship between the two reversed while the overnight rate was falling.
That is worth stating plainly because of how often the two are treated as one lever. They are not. The overnight rate is set. The ten-year is the price at which people are willing to lend for a decade, and over this window it has moved in one direction regardless of what the short rate did.
Three years in which waiting did not pay
Consider what the record says to anyone who deferred a long-dated financing in the expectation of a better rate. The 2023 observation came in above 2022. The 2024 observation came in above 2023. The 2025 observation is higher again. Three consecutive years of waiting have each ended with the benchmark above where the wait began, and this series contains no year in which that wait was rewarded.
The benchmark is also only the floor of the actual cost. A constant maturity rate is a government yield, and every other borrower pays it plus a spread for credit, structure and tenor. None of that spread is in this series. A project treating 4.29 percent as its cost of capital is reading the cheapest possible component of it. What the series sets is the base against which those spreads are quoted, which is why its direction matters more than its exact level on any particular day.
There is a real limit on what six annual averages can say. They cannot tell you where within each year the yield sat, they cannot distinguish the causes of any move, and they are an interpolated benchmark rather than a rate anyone actually paid. Five changes are not a trend line and will not forecast the sixth.
But the direction is not ambiguous, and the absence of any downward step is a fact about the record rather than an interpretation of it. Long-dated capital is being priced off a benchmark that has risen at every annual observation in this window, and a plan that assumes relief at the long end is assuming something that has not yet happened even once.
Method and data
The figures are annual averages of the ten-year Treasury constant maturity rate, published by the Board of Governors of the Federal Reserve System and redistributed by FRED, retrieved for this site on 19 September 2026.
A constant maturity rate is a yield interpolated to a fixed ten-year horizon from the Treasury yield curve. It is not the coupon on any single bond, and it is not a total return.
Where the overnight policy rate appears alongside it, that is the federal funds effective rate on annual averages from the same publisher. The two series are differently constructed, one a market yield and one a realised overnight rate, and comparing two annual averages is not a reading of the yield curve on any given day.
The 2025 observations average the periods available at retrieval and are not full-year figures.
All differences quoted are arithmetic differences between published annual averages. Nothing here is estimated or projected.
How to cite
Jag DeSaint, "The ten-year yield has risen in every year since 2020," The Cefa Brief, Applied America, 6. August 2025, https://applied.thecefa.org/cefa-brief/the-long-end-has-not-fallen.
About the author

Each author told us that for this piece they hold no interest a reader would think relevant.
This Insights piece carries its author's name because the view in it is the author's own. An editor reviewed it before publication, which is not the same as agreeing with it. It is not a position of the Center for Economics & Foreign Affairs or of Applied America.
© 2025. The author or authors hold the copyright in this Insights piece; CEFA publishes it with their permission. This edition, its editing and its presentation are © 2025 Center for Economics & Foreign Affairs. To republish it, see our republication terms. Republishing
Share
The Cefa Brief · applied.thecefa.org/cefa-brief/the-long-end-has-not-fallen · Printed from the web edition