
The states that make the most things are not the states with the most engineers
Of the eight states where production work is most concentrated, four hold less than the national share of architecture and engineering jobs and two more hold barely the national share. That gap, not the incentive package, is the binding constraint on where a complex facility can be built and run.
by
Vantage point
I write as an editor reading the same published federal labour statistics that any state's economic development office can download, and asking what a site-selection conversation would sound like if it started there.
Published 7 minute read

Abbildung: The Cefa Brief
Five years of American industrial policy have been argued mostly about buildings. Which site is ready, what the package is worth, how fast the permit moves, whether the pad can take the load. I want to put a different constraint in front of that conversation, because the 2025 occupational data makes it visible and almost nobody prices it. A building can be financed in a year and built in three. The engineering workforce that specifies it, commissions it and keeps it running is a stock that took decades to accumulate, and it does not sit in the same states as the production work.
The measure I am using is the location quotient, which the Bureau of Labor Statistics publishes alongside its state employment counts. It is an occupation's share of one state's jobs divided by that occupation's share of national jobs. A value of 1.00 means the state holds exactly the national share. Above 1.00 means more concentrated than the country, below means less. It is a share, not a headcount and not a judgement about quality, and I will come back to what it cannot say. For now it is the cleanest way to ask a question that headcounts answer badly: relative to everything else that state does, how much engineering is there?
Two maps that barely overlap
Take the eight states where production work is most concentrated in 2025, meaning a location quotient of 1.50 or higher for Production Occupations. They are Indiana at 2.01, Alabama at 1.85, Wisconsin at 1.82, Michigan at 1.72, Iowa at 1.66, Kentucky at 1.64, Arkansas at 1.62 and Mississippi at 1.53. Indiana's figure is the highest in the country: production work is twice as large a share of Indiana's job base as it is of the nation's. In absolute terms these are serious industrial labour markets. Indiana carries 353,630 production jobs, Michigan 417,920, Ohio just below the cut at 451,510.
Now look at the same eight states through Architecture and Engineering Occupations. Michigan is at 1.76 and Alabama at 1.39. Wisconsin is at 1.03 and Indiana at 0.97, which is to say they hold about the national share and nothing more. The remaining four sit below it: Kentucky 0.82, Iowa 0.80, Mississippi 0.73, Arkansas 0.60. The state with the most concentrated production workforce in the United States has a merely average engineering workforce. The state with the seventh most concentrated has three fifths of the national share.
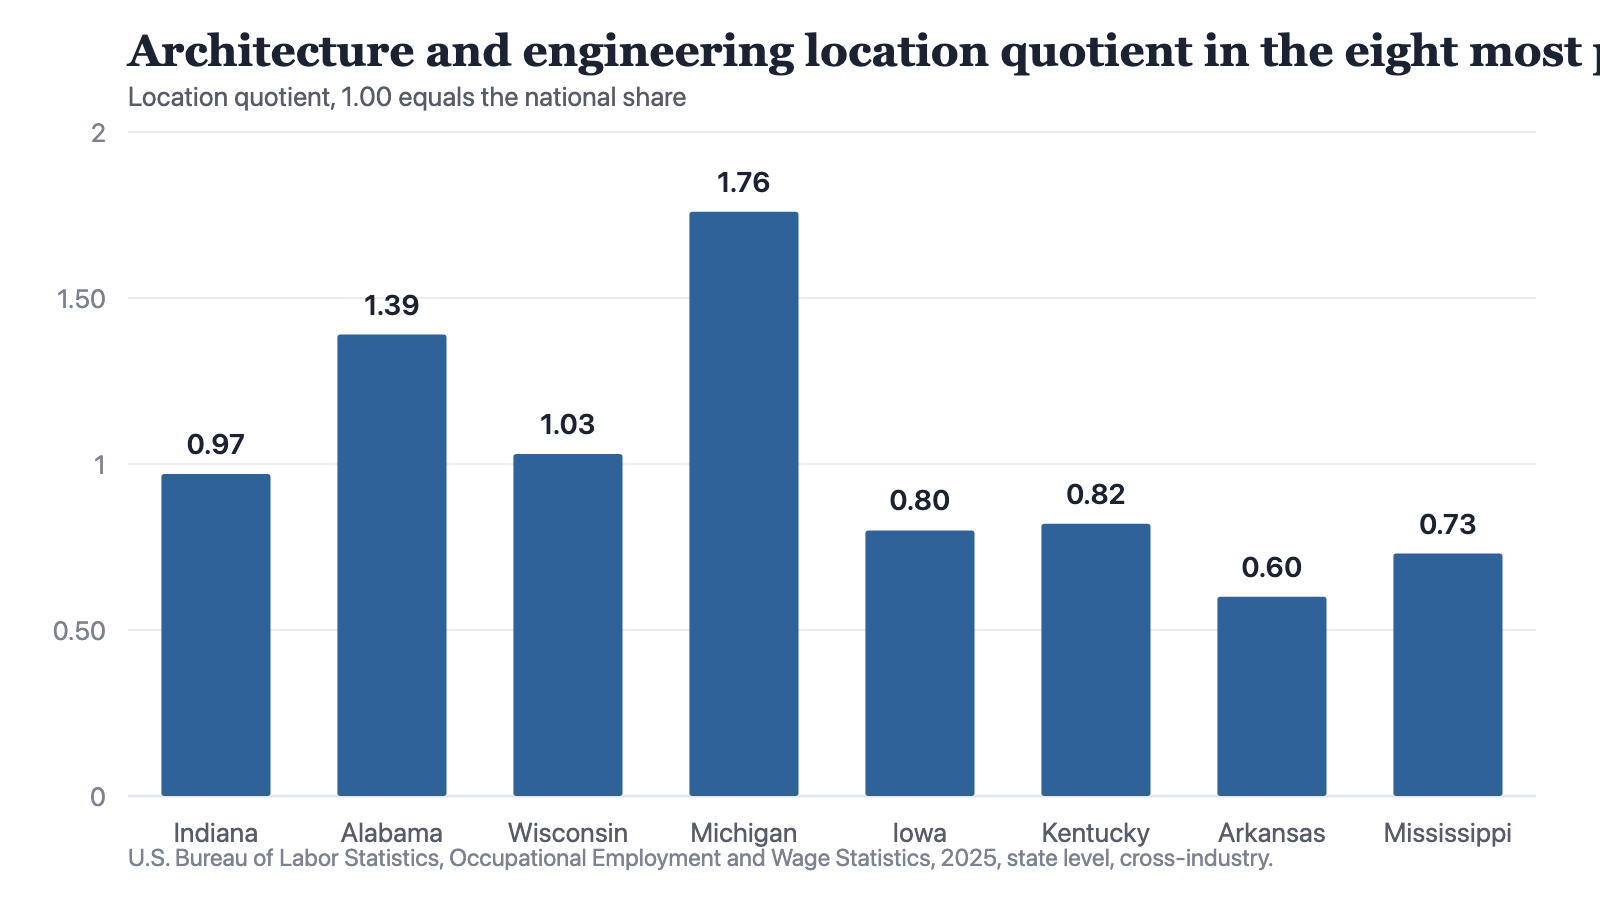
Notes: A location quotient of 1.00 means the state holds exactly the national share of that occupation. The eight states are those with a production location quotient of 1.50 or above.
Source: The Cefa Brief
Chart description
Ordered by how concentrated each state's production workforce is, from Indiana at 2.01 down to Mississippi at 1.53, the engineering location quotients run 0.97 for Indiana, 1.39 for Alabama, 1.03 for Wisconsin, 1.76 for Michigan, 0.80 for Iowa, 0.82 for Kentucky, 0.60 for Arkansas and 0.73 for Mississippi. Only Michigan and Alabama hold a clearly above-national share of engineering employment. Four of the eight hold less than the national share.
Ordered by how concentrated each state's production workforce is, from Indiana at 2.01 down to Mississippi at 1.53, the engineering location quotients run 0.97 for Indiana, 1.39 for Alabama, 1.03 for Wisconsin, 1.76 for Michigan, 0.80 for Iowa, 0.82 for Kentucky, 0.60 for Arkansas and 0.73 for Mississippi. Only Michigan and Alabama hold a clearly above-national share of engineering employment. Four of the eight hold less than the national share.
The mirror image is just as sharp. The states most concentrated in engineering are, with one exception, not manufacturing states at all. New Mexico leads the country at 1.85, with 27,170 engineering jobs and a production location quotient of 0.60. Colorado is at 1.51 for engineering and 0.59 for production. Washington is 1.31 and 0.82. Massachusetts is 1.29 and 0.70. Oregon is 1.27 and 1.00. These are places with a heavy design, research and technical base and a comparatively light manufacturing floor.
The exception is Michigan, which is second in the country on engineering jobs per thousand at 29.55 and fourth on production concentration at 1.72. It holds 130,140 engineering jobs, third behind California's 327,600 and Texas's 249,090, on a total employment base less than a third of California's. Alabama is a partial second case, at 1.39 engineering against 1.85 production. Whatever else one says about industrial geography, two states have both halves of the capability in the same place, and the rest have one or the other.
The strongest objection
The serious answer against all this is that engineers are mobile and firms bring their own. A company siting a plant in Kentucky does not hire Kentucky's existing engineering share. It relocates a commissioning team, contracts an engineering firm headquartered somewhere else, and trains up locally over the following decade. On that reading a state's engineering location quotient describes yesterday's economy and says nothing about tomorrow's plant. There is also a narrower objection: a location quotient is a share, and a low share is not a shortage. A state could be perfectly well supplied in absolute terms and still show 0.60 because everything else about its job base is large.
Both objections are real and neither is fatal. On mobility: the survey counts jobs where they are physically located, so a firm that flies a team in and out has not added to the state's count, and that is exactly the point. The capability is being rented, and rented capability leaves. The stocks here are also very large and very slow. California's 327,600 engineering jobs and Michigan's 130,140 were not assembled by an incentive package and will not be relocated by one. On shares: the share is the right unit precisely when the question is what else a state can do with the same people. A state bidding for a complex facility is not bidding with spare engineers. It is bidding with engineers who already have employers.
I will not take the further step of calling any of this a shortage, because this file cannot support that word. There are no vacancy counts here, no time series, no measure of unmet demand. What there is, is a wage line, and it is worth reading carefully rather than dramatically. Indiana's engineering median is 88,050 dollars against a state median wage of 47,860. Alabama's is 99,990 against 45,670. New Mexico's is 128,000 against 47,210. Those ratios tell you the occupation is scarce and valuable relative to everything around it in every one of these states. They do not tell you whether the next hundred engineers can be found.
The same wage line does something else that is easy to miss. Across these eight states the engineering median is remarkably stable, running from 77,700 dollars in Arkansas to 99,990 in Alabama, while the state median wage underneath it moves very little either, from 40,120 in Mississippi to 50,270 in Wisconsin. Engineering is not being bid up in the states that already have the most of it. Michigan's engineering median is 99,640 on the second-densest engineering base in the country. New Mexico's is 128,000 on the densest. Whatever is setting these wages, it is not a simple story of scarce states paying more.
What this data cannot tell you
Four limits matter enough to state before anyone acts on the paragraphs above.
- The major group is broad. Architecture and Engineering Occupations includes architects, surveyors and engineering technicians alongside degreed engineers. It is not a count of people who can sign off a process design.
- The survey is cross-industry and does not say who employs anyone. A state's engineering employment may sit in federal laboratories, in defence work, in utilities or in oil and gas, and none of it is a pool available to a new private entrant.
- There is one observation. This file holds 2025 and nothing before it, so no trend, no direction of travel, and no claim about whether any state's engineering base is growing or thinning.
- There is nothing below the state. No metro, no county, no travel-to-work area. A state-level share can conceal an engineering cluster three hundred miles from the proposed site.
Those limits narrow what the numbers license, and they do not touch the central observation, which survives all four. The production map and the engineering map are different maps. That is a fact about where things are in 2025, and it holds whatever the cause and whatever happens next.
What follows from it
For a state government, the practical consequence is that the labour side of a bid deserves the same diligence as the site side, and usually gets far less. A state can describe its acreage, its power, its rail and its tax treatment in a single afternoon. Almost none can describe, in the same detail, what their engineering base actually is, where it is employed now, and what it would take to add to it. That is a document a state can build from published data in a week, and the fact that the data is public means a serious counterparty will build it anyway.
For anyone allocating capital or advising a ministry, the consequence is a question to ask before the site visit rather than after it. Not how many workers are available, which nobody can answer honestly, but what this state's job base is already concentrated in, and whether the facility needs the thing the state has or the thing it lacks. A plant that needs production labour and a technical service contract is a different proposition from one that needs a resident engineering organisation. Indiana answers the first question extremely well. It does not, on this evidence, answer the second.
There is a third reader for this, and it is the one I had in mind while writing. A foreign ministry or sovereign investor assessing an American location is usually shown a package: a site, an authority, a schedule of benefits, a letter from a governor. None of that describes the industrial base the facility will actually live inside. The occupational file does, imperfectly and one year late, and it is free. A delegation that arrives having already read it asks better questions and is harder to sell to, which is the whole of the advantage.
A state bidding for a complex facility is not bidding with spare engineers. It is bidding with engineers who already have employers.
The reason to publish a chart like this one is not that it settles anything. It is that the incentive conversation is conducted in numbers everyone can produce, and the workforce conversation is conducted in adjectives. Skilled, available, ready, strong. The occupational data is not perfect and it is one year old at best, but it is specific, it is public, and it is the same for every state, which means it can be argued with. An adjective cannot.
How to cite
Jag DeSaint, "The states that make the most things are not the states with the most engineers," The Cefa Brief, Applied America, 14. Juli 2026, https://applied.thecefa.org/cefa-brief/the-engineers-are-not-where-the-factories-are.
About the author

Each author told us that for this piece they hold no interest a reader would think relevant.
This Perspectives piece carries its author's name because the view in it is the author's own. An editor reviewed it before publication, which is not the same as agreeing with it. It is not a position of the Center for Economics & Foreign Affairs or of Applied America.
© 2026. The author or authors hold the copyright in this Perspectives piece; CEFA publishes it with their permission. This edition, its editing and its presentation are © 2026 Center for Economics & Foreign Affairs. To republish it, see our republication terms. Republishing
Share
The Cefa Brief · applied.thecefa.org/cefa-brief/the-engineers-are-not-where-the-factories-are · Printed from the web edition