
ErklärstückStates & Communities
What a state unemployment rate leaves out
The rate is a fraction whose denominator moves. By the end you will know why it can fall while a state's workforce shrinks, and why it counts residents when payroll figures count jobs.
Prepared by
Last reviewed Published 3 minute read

Abbildung: The Cefa Brief
A state's unemployment rate is a fraction. The numerator is the number of residents who had no job in the reference week, were available for work, and had actively looked for work at some point in the previous four weeks. The denominator is the labour force, which is that same group added to everyone who was employed. A person who wants a job but has stopped looking appears in neither figure. They leave the rate untouched.
That is the single most important thing to know about the measure. Because the denominator is people working or actively looking, rather than the working-age population, the rate can fall for two opposite reasons. People can find work, which is good news. Or people can give up looking, which is not. The rate by itself does not distinguish between them, and it is not designed to.
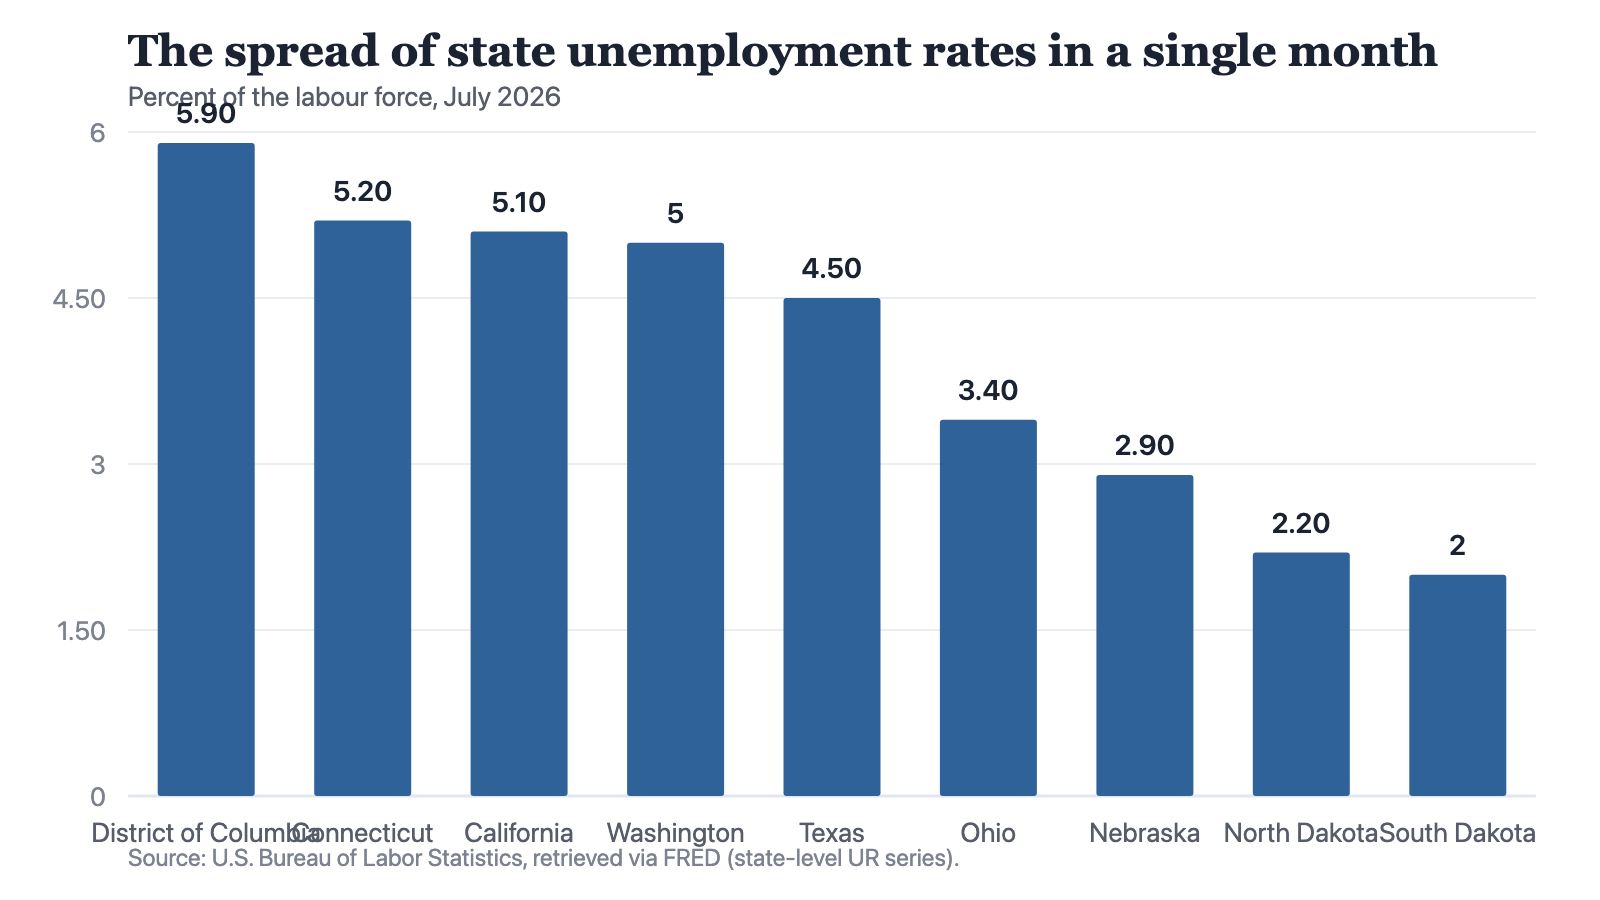
Notes: Source: U.S. Bureau of Labor Statistics, retrieved via FRED (state-level UR series). These are model-based estimates, not direct counts, and they are revised.
Source: The Cefa Brief
Chart description
Nine bars, tallest on the left. The District of Columbia is highest at 5.9 per cent, then Connecticut at 5.2, California at 5.1 and Washington at 5. Texas sits in the middle at 4.5. The right-hand side falls away through Ohio at 3.4, Nebraska at 2.9 and North Dakota at 2.2 to South Dakota at 2. The decline from left to right is steady, with no sudden break anywhere in the ranking.
Nine bars, tallest on the left. The District of Columbia is highest at 5.9 per cent, then Connecticut at 5.2, California at 5.1 and Washington at 5. Texas sits in the middle at 4.5. The right-hand side falls away through Ohio at 3.4, Nebraska at 2.9 and North Dakota at 2.2 to South Dakota at 2. The decline from left to right is steady, with no sudden break anywhere in the ranking.
The denominator moves too
California's unemployment rate was lower in July 2026 than in June. Over the same two months the state's civilian labour force was smaller and its non-farm payroll employment was lower as well. New York shows the same pattern: a lower rate, a smaller labour force, fewer payroll jobs. Illinois also recorded a lower rate over those two months, but its payroll employment rose. On the rate alone, all three states look the same.
Nothing in that comparison is unusual and none of it means a published rate is wrong. It means the rate is a ratio, and a ratio can improve because its top falls or because its bottom falls. Reading it next to the level of the labour force and the level of payroll employment costs nothing and heads off the most common misreading of the series.
Residents, not jobs
The unemployment rate is a place-of-residence measure: it asks where people live. Payroll employment is a place-of-work measure: it counts jobs located in the state, whoever fills them. In most states the two run close enough that the distinction rarely bites. In the District of Columbia it is decisive, because the payroll jobs located there outnumber the District residents in the labour force, and a large share of that workforce commutes in from Maryland and Virginia. The commuter's job is counted in the District. The commuter's unemployment, should it come, is counted at home.
The rate counts residents. Payroll employment counts jobs. A commuter appears in one place and lives in another.
State rates are also estimates rather than counts. The household survey that produces the national figure is too small to support a reliable monthly reading in every state, so the Bureau of Labor Statistics builds state estimates with a model that draws on survey responses, payroll data and unemployment insurance claims. Those estimates are revised. The smallest states carry the widest uncertainty, because they have the least direct survey evidence behind them, which is one reason a tenth of a point of movement in a small state rarely means anything.
Where economists disagree
Few people dispute how the rate is built. The argument is about how much weight it should carry. One view holds that the headline rate is still the best single summary of labour market slack, because it is timely, consistent across states and across decades, and widely understood. Another holds that it systematically understates hardship, and that the broader measures, which add discouraged workers, people marginally attached to the labour force, and people working part time because they cannot find full-time work, track the experience of a state's workers more faithfully. The dispute is not about arithmetic. It is about whether someone who has given up looking should be counted as unemployed.
A test you can apply. Whenever a state's unemployment rate moves, find two other numbers before you draw a conclusion: the size of the labour force and the level of payroll employment. If the rate fell while both of those fell, the state did not necessarily gain anything. Something left the denominator.
About the author
Each author told us that for this piece they hold no interest a reader would think relevant.
Explainers are written and kept up to date by The Cefa Brief’s editors. An Explainer is background CEFA stands behind. It is not one author’s argument, and it is not a CEFA position on what anyone should do. If something here is wrong or out of date, write to applied@thecefa.org.
© 2026 Center for Economics & Foreign Affairs. To republish it, see our republication terms. Republishing
Share
The Cefa Brief · applied.thecefa.org/cefa-brief/what-a-state-unemployment-rate-leaves-out · Printed from the web edition