
Public capital is allocated by the form of the claim, and the only contest the statistics show is inside one construction total
Spending on manufacturing plant went from 75 billion dollars in 2020 to 244 in 2024 and 215 in 2025, while housing units authorised by permit ended the window 48 thousand below where they began. Neither total separates public money from private, and nothing in the record decomposes the federal balance into the claims that competed for it.
by
Vantage point
I am an analyst writing inside The Cefa Brief, working from published statistics and public documents and from nothing else. The figures here are annual series redistributed by FRED and retrieved for this site on 19 September 2026, read alongside each agency's own account of what its series counts. I hold no appropriation file, no programme ledger and no project list. Nothing in front of me records a decision being taken, a claim being refused, or the reason given for either, and the totals I can read do not separate public money from private money.
Published 6 minute read

Abbildung: The Cefa Brief
Allocation is usually argued as a level. How much for plant, how much for research, how much for housing, with the dispute conducted in totals. The more durable question is what the allocating mechanism is able to recognise as a claim in the first place. An appropriation has a period. A programme has an object. An audit has a date. Those three properties work as a filter before any comparison of merit begins, and a claim that fails them is not so much rejected as never scored.
Where this is written from
I am an analyst writing inside The Cefa Brief, working from published statistics and public documents and from nothing else. The figures here are annual series redistributed by FRED and retrieved for this site on 19 September 2026, read alongside each agency's own account of what its series counts. I hold no appropriation file, no programme ledger and no project list. Nothing in front of me records a decision being taken, a claim being refused, or the reason given for either, and the totals I can read do not separate public money from private money.
That position reads the residue of an allocation well and the act of allocation not at all. Aggregate series show what was spent, in which category and in which year, which is enough to test whether a claim about composition is consistent with the record. They cannot show a choice being made between two claims, because no file here holds two claims side by side. The construction and research totals used below do not separate public outlay from private, so everything that follows is an argument about what the record makes visible, and it stops where the record stops.
The one contest the record lets you watch
Construction spending is the place where competing claims are counted separately enough to be set against each other. Spending on manufacturing plant runs 75 billion dollars in 2020, 82 in 2021, 125 in 2022, 202 in 2023, 244 in 2024 and 215 in 2025. All nonresidential construction spending runs 856, 845, 968, 1,193, 1,295 and 1,309 across the same years. Both series are stated at a seasonally adjusted annual rate, so each point is a yearly rate and approximates the year. Dividing the first by the second gives 8.8 percent in 2020, then 9.7, 12.9, 16.9, 18.8 in 2024 and 16.4 in 2025. The Census Bureau publishes both totals and does not publish that ratio; the files here do not record which categories make up the nonresidential total, so it is one series set against another rather than a share the agency certifies.
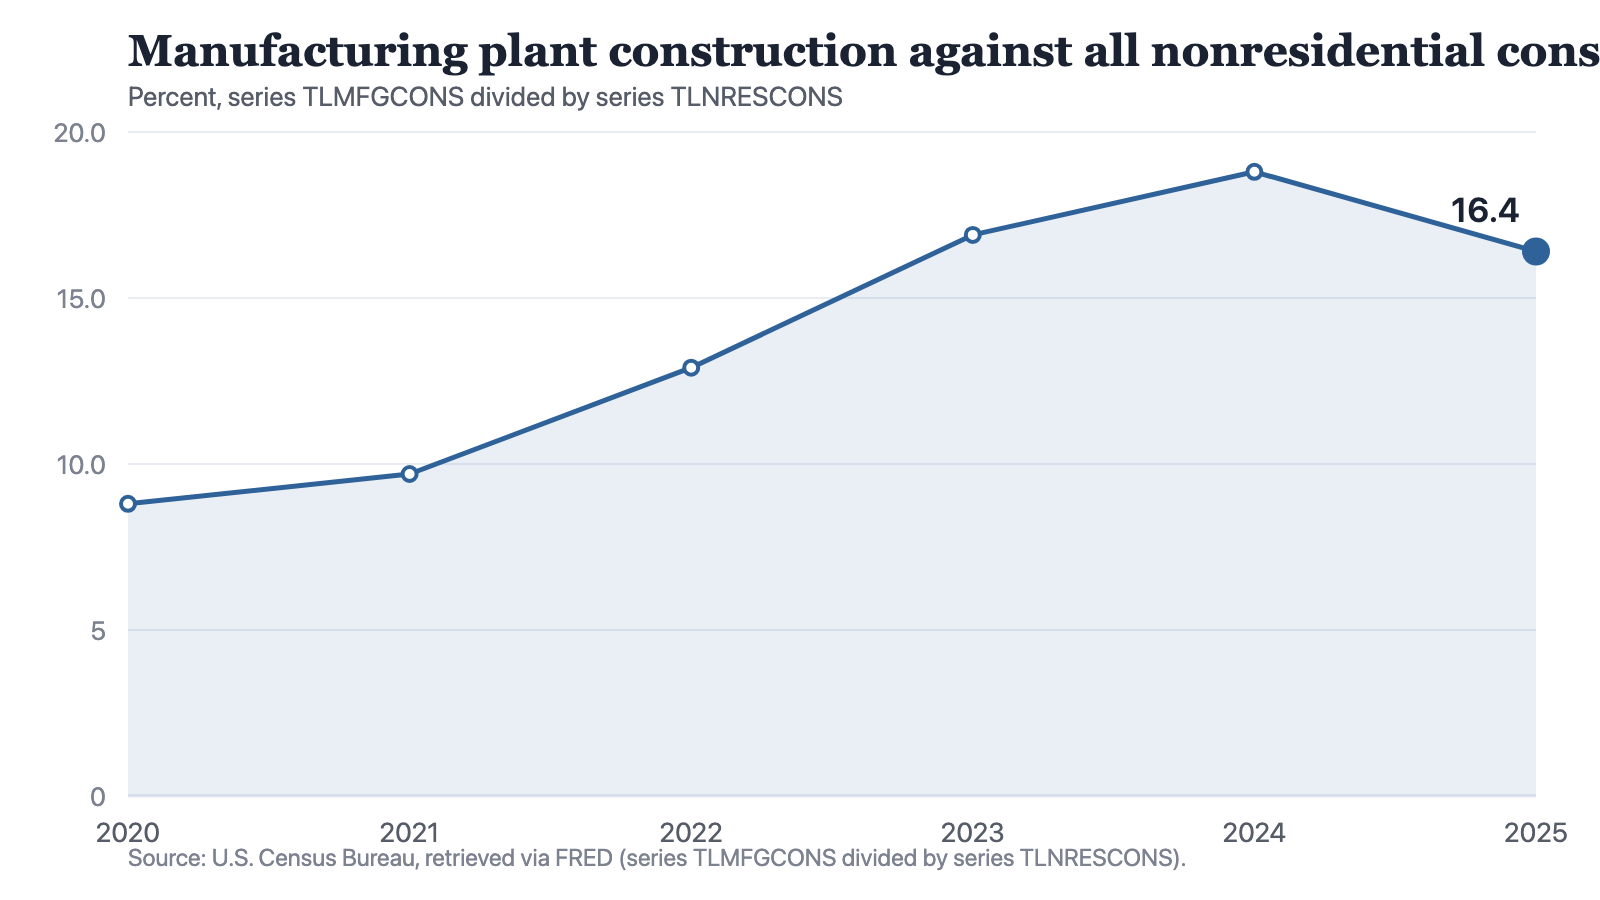
Notes: Series TLMFGCONS divided by series TLNRESCONS, U.S. Census Bureau, both in billions of dollars at a seasonally adjusted annual rate, so each point is a yearly rate and approximates the year. The ratio is arithmetic performed here and is not published by the agency; the files read for this piece do not record which categories make up the nonresidential total. Neither series separates publicly funded work from privately funded work.
Source: The Cefa Brief
Chart description
A line chart of manufacturing plant construction spending divided by all nonresidential construction spending: 8.8 percent in 2020, 9.7 in 2021, 12.9 in 2022, 16.9 in 2023, 18.8 in 2024 and 16.4 in 2025. The line rises at every step to its high at 2024, most steeply between 2022 and 2023, and then falls 2.4 points in the final year to a level still well above where it began.
A line chart of manufacturing plant construction spending divided by all nonresidential construction spending: 8.8 percent in 2020, 9.7 in 2021, 12.9 in 2022, 16.9 in 2023, 18.8 in 2024 and 16.4 in 2025. The line rises at every step to its high at 2024, most steeply between 2022 and 2023, and then falls 2.4 points in the final year to a level still well above where it began.
The last step deserves care. Plant spending fell 29 billion dollars between 2024 and 2025 while the nonresidential total rose 14 billion, and the ratio fell 2.4 points. Had plant spending held at 244 against the 2025 denominator of 1,309, the ratio would read 18.6 rather than 16.4, so almost all of the fall is the numerator. What the numerator did is also what a building programme looks like when buildings finish. These series cannot separate a completion profile from a withdrawal of commitment, and anyone who says which of the two occurred is reading something other than this record.
A claim that can finish
The first property the mechanism selects for is an end. A plant has a completion date, an address, a final invoice and a photograph, and the spending on it stops whether or not the plant works. Across the window that claim reached 3.25 times its 2020 level in 2024 and stood at 2.87 times it in 2025. The other large construction claim moved the other way. Housing units authorised by permit run 1,479 thousand in 2020, 1,734, 1,685, 1,516, 1,474 and 1,431 in 2025, also at a seasonally adjusted annual rate, ending 48 thousand below where the window began. Both are construction. Whether they draw on the same contractors and the same materials is not something either series records, and nothing in either measures a competition between them.
A claim that arrives late is priced differently now
The second property is timing, and the price of timing moved inside the window. The ten-year Treasury constant maturity rate runs 0.89 percent in 2020, 1.45, 2.95, 3.96, 4.21 and 4.29 in 2025, each point an annual average of a market rate. The end of the window is 3.4 percentage points above the start. A claim whose return arrives in year twenty is now judged against a benchmark that has moved that far; a claim that spends and finishes inside a budget period is barely touched by it. The record holds the rate. It holds no appraisal that used the rate and no claim that failed one, so the effect can be described and cannot be counted.
A claim that ends has a date, an object and a final invoice. A claim that only continues has none of the three, and no series either.
The envelope settled; the composition did not
Size is the part of this argument that attracts the attention, and it has been the steadier part. The federal surplus or deficit, whose unit string is billions of dollars and carries no period qualifier, runs -3,096 in 2020, -2,774 in 2021, -1,374 in 2022, -1,687 in 2023, -1,815 in 2024 and -1,775 in 2025. The last four observations sit inside a band of 441, against a single-year move of 1,400 between 2021 and 2022. Whatever contest ran through those four years ran inside an envelope that was close to still. The record does not decompose that balance into claims, so the contest itself is invisible here and only its container can be measured.
Research and development inside GDP runs 754 billion dollars in 2020, 839, 942, 991, 1,029 and 1,081 in 2025, also at a seasonally adjusted annual rate, 327 higher at the end than at the start and higher in every single year. That series counts what was spent. It counts nothing about what the spending produced, which makes it an unusually comfortable claim to fund, because the evidence of effort and the evidence of result are the same number. In 2025 it stands at about five times the plant figure of 215, the two being in the same unit in the same year.
What the mechanism selects for
Three properties, then. A claim is easiest to fund when it ends, when it has an object that can be placed in a jurisdiction and a year, and when its cost falls inside a single appropriation period. None of the three says anything about whether the claim is worth funding. Each says whether it can be scored at the moment of decision and checked afterwards. A claim that is continuous, that is produced jointly with other claims, or whose success takes the form of an absence has to be argued for in prose against competitors that arrive carrying a number.
Only three publications would change this view rather than decorate it: a split of the construction and research totals into public and private, a decomposition of the annual federal balance by claim, and a series that counts the running of what was built rather than the building of it. None is in the record read here. Until one is, the defensible sentence stays narrow. One claim's spending reached 3.25 times its 2020 level and eased to 2.87 times it, another ended 48 thousand units lower than it started, the rate against which late claims are judged rose 3.4 points, and the envelope holding both stopped moving. Why any of that happened is not in the file, and naming the gap is better work than filling it.
How to cite
Jag DeSaint, "Public capital is allocated by the form of the claim, and the only contest the statistics show is inside one construction total," The Cefa Brief, Applied America, 5. Oktober 2026, https://applied.thecefa.org/cefa-brief/scored-at-the-moment-of-decision.
About the author

Each author told us that for this piece they hold no interest a reader would think relevant.
This Perspectives piece carries its author's name because the view in it is the author's own. An editor reviewed it before publication, which is not the same as agreeing with it. It is not a position of the Center for Economics & Foreign Affairs or of Applied America.
© 2026. The author or authors hold the copyright in this Perspectives piece; CEFA publishes it with their permission. This edition, its editing and its presentation are © 2026 Center for Economics & Foreign Affairs. To republish it, see our republication terms. Republishing
Share
The Cefa Brief · applied.thecefa.org/cefa-brief/scored-at-the-moment-of-decision · Printed from the web edition