
PerspektiveStates & Communities
Read a state government the way you would read a credit, not a brochure
State tax collections per resident run from 2,279 dollars in Alaska to 8,028 in Vermont, and the spread describes which layer of government collects rather than how heavily anyone is taxed. The useful questions are what the base is, what it is exposed to, and what the state does not levy at all.
by
Vantage point
I write as an editor who is regularly asked by visitors from outside the United States to explain why two American states with similar economies appear to tax at wildly different rates, and who has come to think the question is a symptom of reading the wrong number first.
Published 7 minute read

Abbildung: The Cefa Brief
When a delegation asks me how to read an American state, the first number anyone reaches for is what the state collects per resident. It is easy to compute, it sounds like a burden, and it is the least informative figure in the file. On the fiscal 2025 collections, divided by the Census Bureau's 2024 population estimates, the range across the fifty states runs from 2,279 dollars a resident in Alaska to 8,028 in Vermont. The District of Columbia, which is a city performing state and local functions at once, collects 16,036. A reader who stops there will conclude that Vermont taxes its residents three and a half times as hard as Alaska does, and will be wrong in a way that no amount of further arithmetic on that number can fix.
The reason is that a state government is not a jurisdiction. It is one layer of one, and the layers are divided differently in every state. What a per-resident figure actually measures is which level of government does the collecting, which tax base the state happens to sit on, and what the legislature has chosen or is constitutionally forbidden to levy. Those are three separate facts and they are all in the file. My argument is that a serious reader should ask for them in the order a credit analyst would, and should stop treating the headline ratio as a summary of anything.
Three questions, in order
The first question is what the revenue base is, and the answer is usually one thing. Oregon takes 63.7 percent of all its state tax collections from the individual income tax. Florida takes 62.9 percent from general sales and gross receipts, Texas 62.8, South Dakota 61.6, Washington 59.4 and Tennessee 57.5. Massachusetts takes 53.0 percent from individual income. North Dakota takes 47.2 percent from severance, Alaska 43.9 and New Mexico 31.2. In 43 of the 51 jurisdictions a single line item raises between a third and two thirds of all state tax collections. That is a concentrated position, and if a private borrower presented it as a revenue profile nobody would call it diversified.
The second question is what that base is exposed to. A sales base moves with consumption, an income base with employment and capital gains, a severance base with a commodity price the state does not set. The file does not date these exposures or trend them, and I am not going to pretend otherwise. But a reader looking at North Dakota's 47.2 percent severance share knows something structural about the state's revenue that no per-resident figure will tell them, and it is the thing that matters to a counterparty signing a twenty-year agreement.
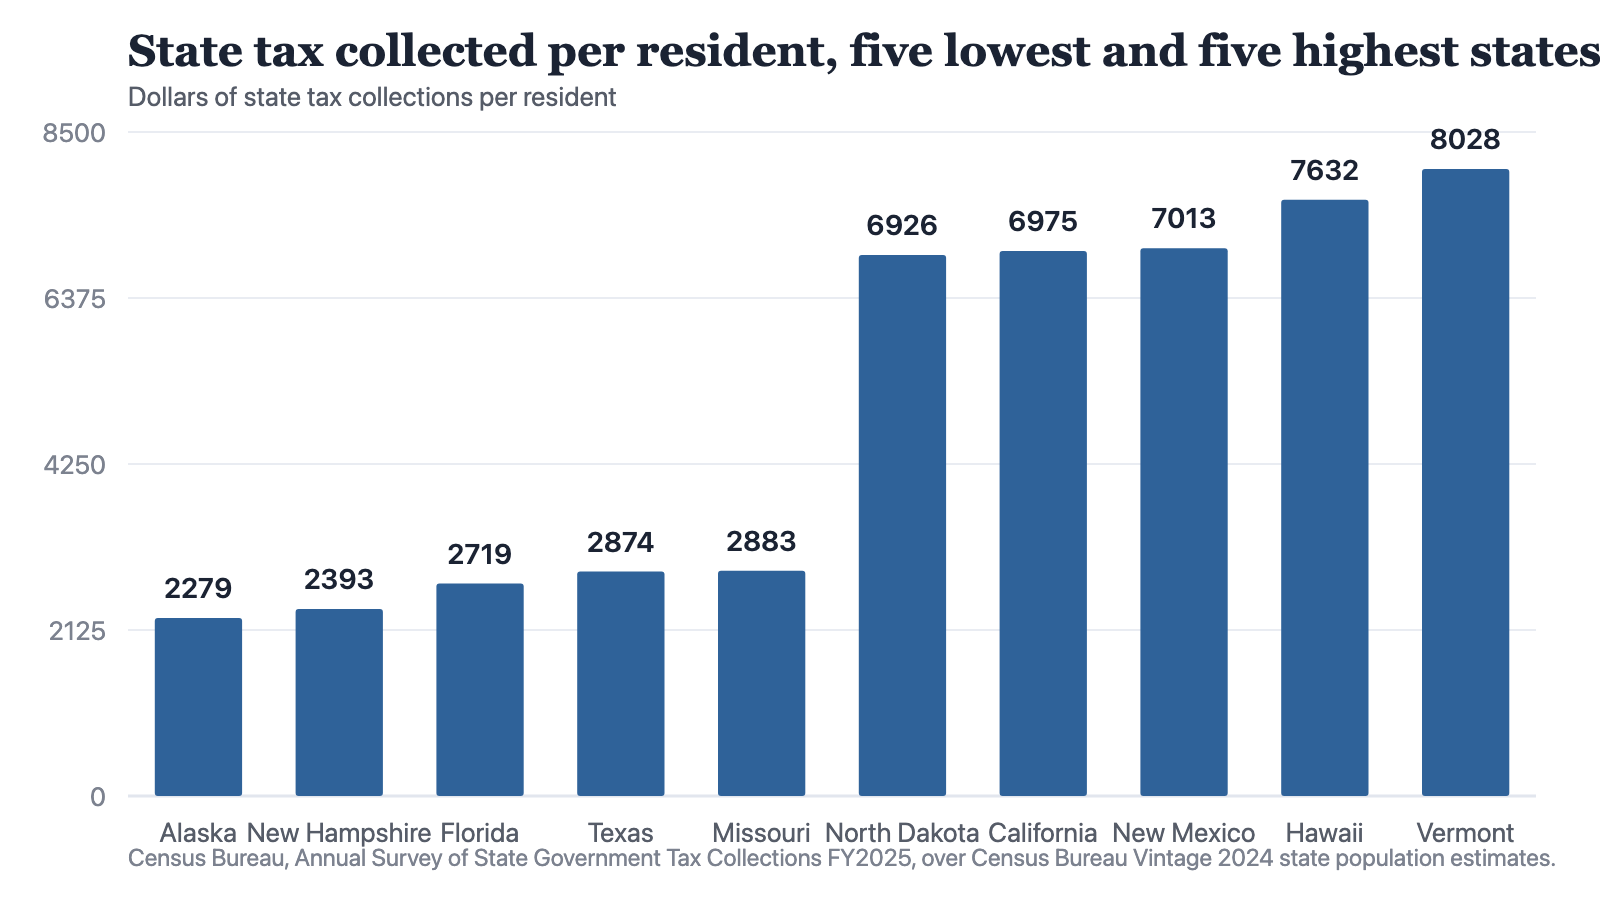
Notes: Two sources joined: collections are Census Bureau fiscal year 2025, population is the Census Bureau Vintage 2024 estimate. The District of Columbia is excluded at 16,036 dollars a resident because it performs state and local functions in a single city government.
Source: The Cefa Brief
Chart description
The five lowest are Alaska at 2,279 dollars a resident, New Hampshire 2,393, Florida 2,719, Texas 2,874 and Missouri 2,883. The five highest are North Dakota 6,926, California 6,975, New Mexico 7,013, Hawaii 7,632 and Vermont 8,028. The spread from Alaska to Vermont is a factor of three and a half. Alaska and North Dakota both raise more than 40 percent of their collections from severance taxes and sit at opposite ends of this chart, which is the clearest demonstration that the per-resident figure does not describe fiscal structure.
The five lowest are Alaska at 2,279 dollars a resident, New Hampshire 2,393, Florida 2,719, Texas 2,874 and Missouri 2,883. The five highest are North Dakota 6,926, California 6,975, New Mexico 7,013, Hawaii 7,632 and Vermont 8,028. The spread from Alaska to Vermont is a factor of three and a half. Alaska and North Dakota both raise more than 40 percent of their collections from severance taxes and sit at opposite ends of this chart, which is the clearest demonstration that the per-resident figure does not describe fiscal structure.
Those last two states make the case better than any argument. Alaska takes 43.9 percent of its collections from severance and North Dakota 47.2 percent. Structurally they are the same kind of government, funded by the same kind of thing. Alaska is the lowest collector per resident in the country and North Dakota the fifth highest among the states, at three times the level. The ratio has told the reader nothing about the exposure, and the exposure is the part that would keep a lender awake.
What a state does not levy is a fact, not a gap
The third question is what is absent, and this is where the file is unusually disciplined. Where a state does not levy a tax, the source records the absence as a fact rather than leaving a blank to be imputed. Six states levy no individual income tax: Alaska, Florida, Nevada, South Dakota, Texas and Wyoming. Four levy no corporation net income tax: Nevada, Texas, Washington and Wyoming. Four levy no general sales and gross receipts tax: Alaska, Delaware, Montana and New Hampshire. Fifteen record no severance tax line at all. Texas appears on two of those lists and has no state property tax either, which is to say it funds itself from a sales base and a severance base and very little else.
The property tax entry is the one that most often misleads a foreign reader, and it deserves stating plainly. Fourteen states record no state-level property tax: Colorado, Connecticut, Delaware, Florida, Hawaii, Idaho, North Carolina, New York, Ohio, Oklahoma, South Dakota, Tennessee, Texas and Utah. Property is taxed in all of them. It is taxed by counties, municipalities and school districts, which this file does not cover. Vermont, at the top of the chart, takes 28.7 percent of its state collections from a state property tax, its single largest item. Vermont is not taxing property harder than New York. It is collecting at the state level what New York collects locally, and the per-resident figure reads that difference as if it were a difference in burden.
New Hampshire is the other instructive case, and the second lowest collector per resident at 2,393 dollars. Its largest single item is the corporation net income tax at 32.9 percent of collections, which is true of no other state in the file. It levies no general sales tax and its individual income line comes to 2.7 percent of the total. A state with that structure has a revenue base concentrated in corporate profitability, which is the most cyclical of the five items here, and a headline per-resident figure that makes it look lightly taxed. Both things are true at once and only one of them is visible in the ratio.
One more detail of the same kind, because it is the sort of thing that survives in shorthand long after the file has stopped supporting it. Washington is commonly described as a state with no income tax. This file records an individual income tax line for Washington contributing 1.4 percent of its collections. It is small, and it is not nothing, and the correct description of a state is whatever the current source says rather than whatever everyone remembers.
Two objections
The first objection is that all of this proves cross-state comparison is impossible, in which case the chart above should not have been drawn. I would put it differently. The comparison is impossible as a measure of burden and perfectly sound as a measure of what one specific layer of government raises, which is what the source says it is. A number is not disqualified by having a narrow meaning. It is disqualified by being used outside it, and the remedy is a caption, not silence.
The second objection is heavier: that reading a state as a credit imports language from a setting where it does not belong. American states do not default, they cannot be liquidated, and the analogy invites a kind of scepticism that a democratic government has not earned. I take the point about tone and not about substance. Revenue concentration does not show up in a state as insolvency. It shows up as a budget cut in the third year of a five-year programme, a deferred maintenance cycle, a hiring freeze in the agency that issues the permit, and a counterparty whose behaviour over the life of a long contract is more variable than the contract assumed. Anyone committing capital on a twenty-year horizon is already exposed to that. They may as well look at it.
The limits of this file
Six things this source cannot do, all of which bear on the paragraphs above.
- It covers state government tax collections only. County, municipal and school district taxation is outside it entirely, and in several states that is where most of the money is raised.
- It itemises five taxes, and they do not add to the total. The five cover 47.9 percent of New Hampshire's collections and the same share of Delaware's, against 88.5 percent of Utah's. Everything else is inside the total and unnamed here.
- It is one fiscal year. There is no history, so nothing here shows whether any state's concentration is rising or falling.
- The per-resident figures join two vintages: fiscal 2025 collections over the Census Bureau's 2024 population estimate. That is a legitimate join and it is not a same-date comparison.
- The District of Columbia is in the source and is not a state. It is counted where the file counts it and excluded from the chart, and both choices are stated rather than hidden.
- There is no spending, no debt, no reserve balance and no rating in this file. Revenue structure is one side of a credit and this is a piece about that side only.
Those limits are the reason I would rather publish the structure than the ratio. The ratio invites a conclusion the data cannot carry. The structure invites a question, and the question is answerable from the same public source by anyone who cares to open it.
So the practical version, for a ministry or an investor assessing an American state: ask which single line raises the largest share of that state's own collections and what that line is exposed to; ask which of the five major taxes the state does not levy at all, because the absences describe the politics more sharply than the presences do; and ask which level of government would actually be your counterparty, since in fourteen states the property tax you are worried about is not levied by the state you are negotiating with. None of those questions require a model. They require reading the table before the chart.
Alaska and North Dakota are funded by the same kind of thing and sit at opposite ends of the chart. The ratio has told the reader nothing about the exposure.
I have no quarrel with per-resident figures as a starting point, and this piece opens with one. The quarrel is with stopping there, which is what almost every comparison of American states does, including comparisons produced by people who know better. The file that supports the headline also contains everything needed to qualify it. Publishing the first without the second is not a shortage of data. It is a choice about how much of the argument to hand the reader, and I would rather hand over all of it.
How to cite
Jag DeSaint, "Read a state government the way you would read a credit, not a brochure," The Cefa Brief, Applied America, 18. Juni 2026, https://applied.thecefa.org/cefa-brief/read-a-state-the-way-you-read-a-credit.
About the author

Each author told us that for this piece they hold no interest a reader would think relevant.
This Perspectives piece carries its author's name because the view in it is the author's own. An editor reviewed it before publication, which is not the same as agreeing with it. It is not a position of the Center for Economics & Foreign Affairs or of Applied America.
© 2026. The author or authors hold the copyright in this Perspectives piece; CEFA publishes it with their permission. This edition, its editing and its presentation are © 2026 Center for Economics & Foreign Affairs. To republish it, see our republication terms. Republishing
Share
The Cefa Brief · applied.thecefa.org/cefa-brief/read-a-state-the-way-you-read-a-credit · Printed from the web edition