
What "manufacturing as a share of GDP" actually measures
The share has fallen every year since 2022. That is not the same as making less, and the difference is where most arguments about industrial policy go wrong.
Prepared by
Last reviewed Published 1 minute read

Foto: The Cefa Brief
One number does more work in industrial-policy argument than any other: the share of national output that comes from manufacturing. It is quoted as a verdict on whether a country still makes things. It is not that, and knowing what it is instead changes what follows from it.
What the number is
Gross domestic product is the sum of value added across every industry. Value added is what an industry sells minus what it buys from other industries, so nothing is counted twice. Manufacturing's share is that industry's value added divided by the total. It is a ratio, and a ratio moves when either half moves.
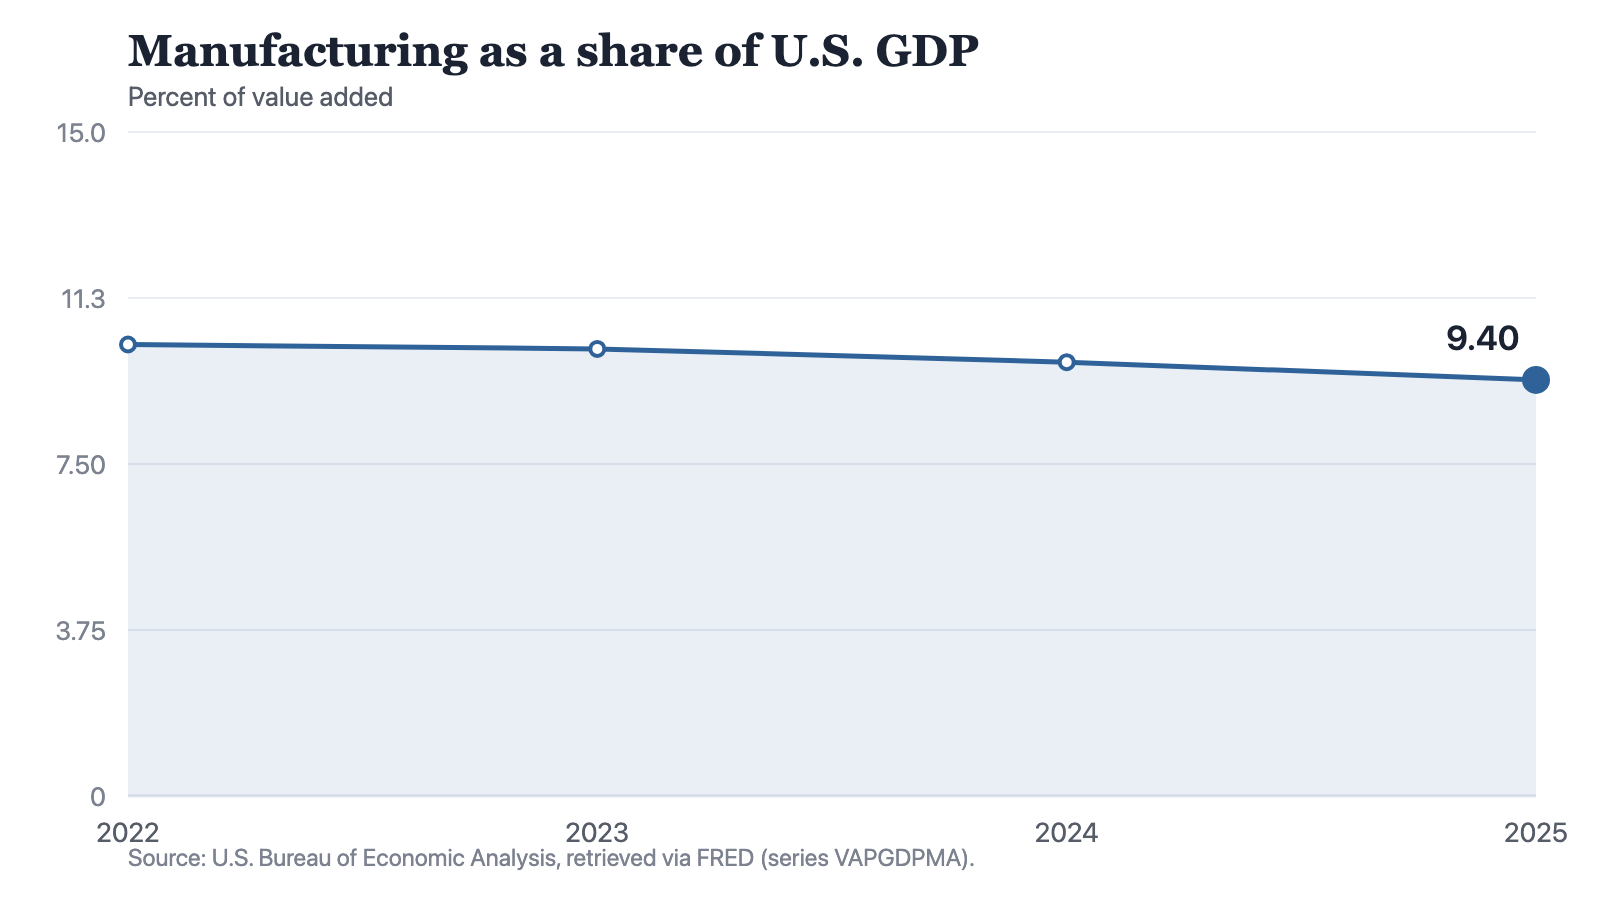
Notes: Figures are annual, in current dollars. Because the measure is a share of a growing denominator, a fall does not by itself mean manufacturing output fell.
Source: The Cefa Brief
Chart description
A line chart with a zero baseline showing manufacturing value added as a percent of U.S. GDP over four years: 10.2 percent in 2022, 10.1 percent in 2023, 9.8 percent in 2024 and 9.4 percent in 2025. The line declines gently and steadily across the period.
A line chart with a zero baseline showing manufacturing value added as a percent of U.S. GDP over four years: 10.2 percent in 2022, 10.1 percent in 2023, 9.8 percent in 2024 and 9.4 percent in 2025. The line declines gently and steadily across the period.
Why it falls while output rises
Three things move this ratio, and only one of them is a factory closing.
- The denominator grows. Services grow faster than manufacturing in almost every advanced economy. If both grow and services grow faster, the manufacturing share falls while manufacturing output rises.
- Prices diverge. Manufactured goods get cheaper relative to services over time. Measured in current dollars, the same physical output is a smaller share of a dollar total each year.
- Activity moves across the boundary. When a manufacturer outsources its logistics, design or maintenance, that work is reclassified as services. Nothing about the product changed; the accounting did.
What it is good for, and what it is not
The share is a reasonable measure of manufacturing's weight in an economy: how much of national income depends on it, and how exposed the economy is to a shock in it. It is a poor measure of industrial capacity, which is a question about physical output, capital stock, skills and supply chains. For capacity, read the output and capacity-utilisation series directly rather than the share.
The practical test: before using the share as evidence, ask which of the three movements above would explain the change you are pointing at. If you cannot say, the number is not yet evidence for anything.
About the author
Each author told us that for this piece they hold no interest a reader would think relevant.
Explainers are written and kept up to date by The Cefa Brief’s editors. An Explainer is background CEFA stands behind. It is not one author’s argument, and it is not a CEFA position on what anyone should do. If something here is wrong or out of date, write to applied@thecefa.org.
© 2025 Center for Economics & Foreign Affairs. To republish it, see our republication terms. Republishing
Share
The Cefa Brief · applied.thecefa.org/cefa-brief/manufacturing-share-of-gdp · Printed from the web edition