
InsightsInternational Partners
The trade gap narrowed in one year of six, and 2025 is now the widest reading of the six
The deficit in goods and services widened from 53 billion dollars a month in 2020 to 75 in 2022, narrowed to 62 in 2023, then widened again to 78 in 2025. The current account, which counts investment income and transfers as well, moved the other way in the final year, so the two measures of the same external gap do not agree on which year is the widest.
by
Published 3 minute read

Illustration: The Cefa Brief
The United States ran a deficit of 78 billion dollars a month in goods and services trade in 2025. That is the widest of the six readings held on this site: 3 billion wider than the 75 billion of 2022, which it displaces, and 25 billion wider than the 53 billion of 2020. One year in the window moves the other way, and it is 2023.
Stated as deficits, in billions of dollars a month, the six readings are 53 in 2020, 69 in 2021, 75 in 2022, 62 in 2023, 74 in 2024 and 78 in 2025.
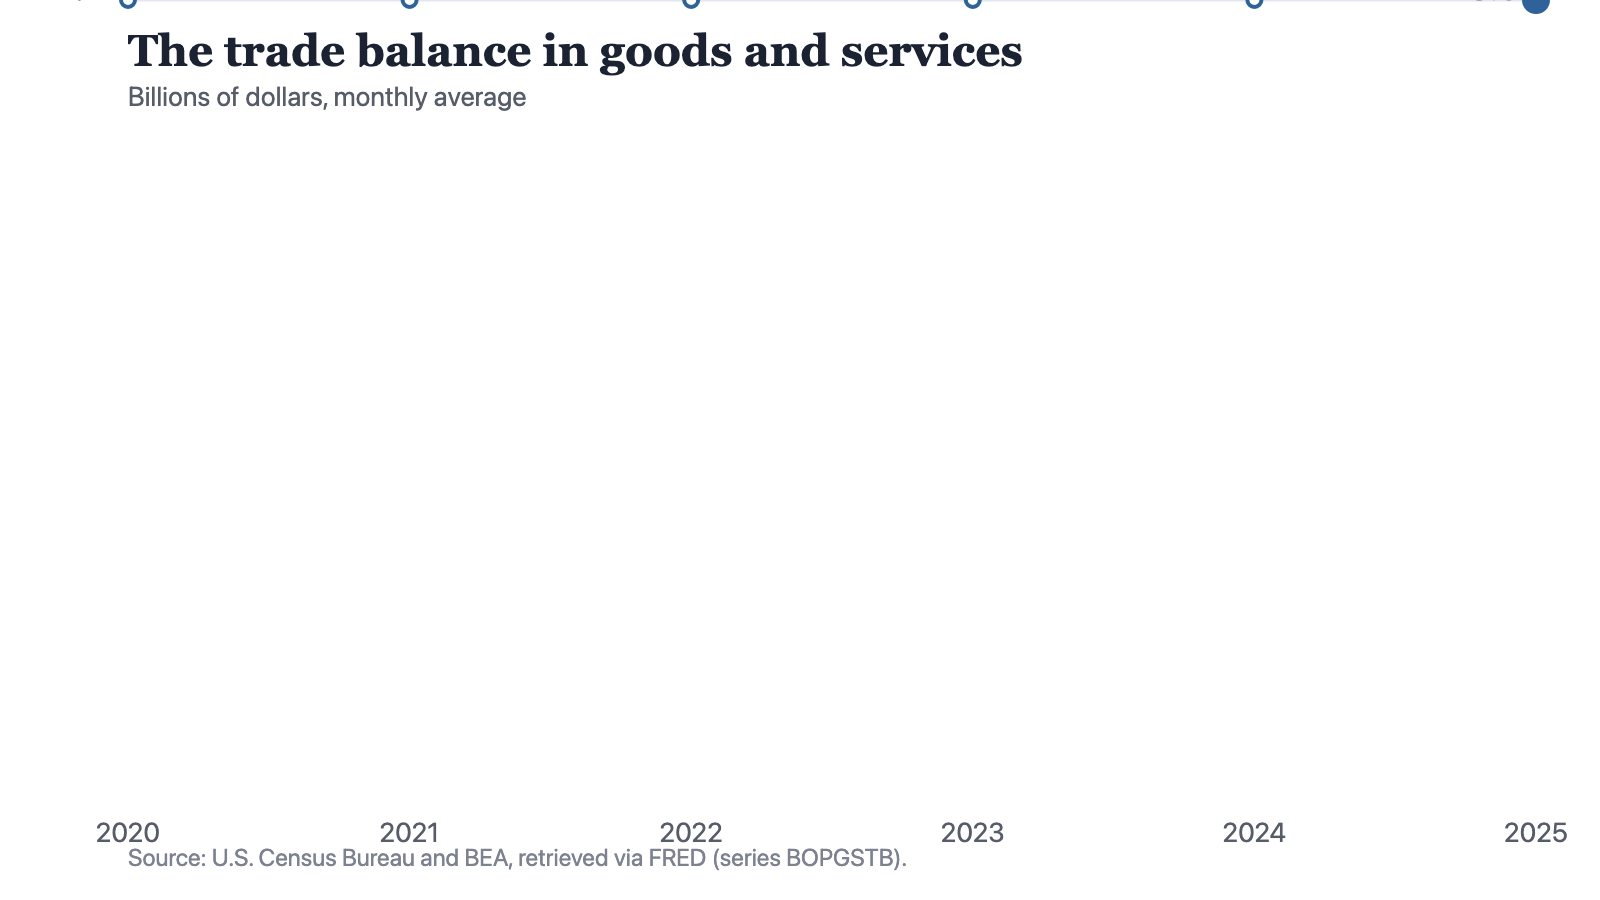
Notes: Annual observations. Each point is the average of the months within the year, not the year's total.
Source: The Cefa Brief
Chart description
A line chart of the U.S. trade balance in goods and services, as a monthly average in billions of dollars: -53 in 2020, -69 in 2021, -75 in 2022, -62 in 2023, -74 in 2024 and -78 in 2025. Every value is below zero, so the whole line is a deficit. The line falls away from zero to 2022, lifts back towards it in 2023, then falls again in 2024 and 2025 to reach its lowest point on the chart.
A line chart of the U.S. trade balance in goods and services, as a monthly average in billions of dollars: -53 in 2020, -69 in 2021, -75 in 2022, -62 in 2023, -74 in 2024 and -78 in 2025. Every value is below zero, so the whole line is a deficit. The line falls away from zero to 2022, lifts back towards it in 2023, then falls again in 2024 and 2025 to reach its lowest point on the chart.
The year that went the other way
Year on year the gap widened by 16 billion, then by 6, then narrowed by 13, then widened by 12 and by 4. Only one of the five steps points towards balance. The 13 billion of narrowing in 2023 was followed by 16 billion of widening across the two years after it, so the reversal is 3 billion larger than the move it undid.
A single year of improvement is the kind of reading that gets carried forward as a turn. This one was not. The 2023 figure of 62 billion a month is the second narrowest of the six, and only 2020, at 53 billion, is narrower; every reading after it has been wider than both.
One year that points towards balance, inside four that do not, is a wobble in a series rather than a turn in it.
A second measure of the same gap
The current account is the wider of the two accounts, adding investment income and transfers to trade in goods and services. It is stored here as a quarterly average, so its figures are not comparable in level with the monthly averages above, only in direction. Its six readings are deficits of 147 billion dollars a quarter in 2020, 214 in 2021, 243 in 2022, 233 in 2023, 300 in 2024 and 294 in 2025.
Both accounts narrowed in 2023, the current account by 10 billion a quarter. At the end of the window they part company. The current account is at its widest in 2024, at 300 billion a quarter, and narrowed by 6 billion in 2025; the goods and services balance is at its widest in 2025, having widened by 4 billion a month to get there. Which of the two is quoted decides which year is described as the worst, and both are published federal series.
What the series does not carry
Two things about the measure itself. The unit is a monthly average, so each annual point is the average of that year's twelve months rather than the year's total, and reading 78 billion dollars as a year's deficit would be wrong by roughly a factor of twelve. And a balance is a single national total: it names no partner, no commodity and no cause, and a gap that widens because exports fell looks identical to one that widens because imports rose.
What these two series support is narrow. The external gap is wider at the end of the window than at the start on both measures, the one year of narrowing on the goods and services balance has been more than undone, and the two accounts disagree about the direction of the most recent year. Why the gap moved is not in either of them. Separating a price effect from a volume effect, or one partner from another, needs series this brief does not hold, and until it holds them the widest reading of the six is a fact about a total and not an explanation of it.
Method and data
The figures are annual observations of the U.S. trade balance in goods and services, series BOPGSTB, compiled by the U.S. Census Bureau and the Bureau of Economic Analysis, and of the balance on the current account, series IEABC, compiled by the Bureau of Economic Analysis. Both are redistributed by FRED and were retrieved for this site on 19 September 2026. The goods and services balance is stated in billions of dollars as a monthly average, which means each annual point is the average of that year's twelve months and not the year's total; reading 78 billion dollars as a year's deficit would be wrong by roughly a factor of twelve. The current account is stated as a quarterly average on the same principle, so each of its points is the average of that year's four quarters, and the two series run on different periodicities and cannot be compared in level. Year-on-year differences quoted in the text are arithmetic performed here on the stored annual averages rather than published change figures. Neither series names a trading partner, a commodity or a cause, neither is adjusted for prices, and balance-of-payments figures are revised after first publication, so a recent reading is a provisional one.
How to cite
Jag DeSaint, "The trade gap narrowed in one year of six, and 2025 is now the widest reading of the six," The Cefa Brief, Applied America, September 29, 2026, https://applied.thecefa.org/cefa-brief/the-widening-undid-the-narrowing.
About the author

Each author told us that for this piece they hold no interest a reader would think relevant.
This Insights piece carries its author's name because the view in it is the author's own. An editor reviewed it before publication, which is not the same as agreeing with it. It is not a position of the Center for Economics & Foreign Affairs or of Applied America.
© 2026. The author or authors hold the copyright in this Insights piece; CEFA publishes it with their permission. This edition, its editing and its presentation are © 2026 Center for Economics & Foreign Affairs. To republish it, see our republication terms. Republishing
Share
The Cefa Brief · applied.thecefa.org/cefa-brief/the-widening-undid-the-narrowing · Printed from the web edition