
ExplainerInternational Partners
How the trade deficit is computed
Several different subtractions are all called the trade deficit. By the end of this you will know which is which, what the matching entry on the other side of the ledger is, and why a balance is not a profit and loss statement.
Prepared by
Last reviewed Published 3 minute read

Illustration: The Cefa Brief
The trade deficit is a subtraction, and the first thing to know is that several different subtractions carry the name. The narrowest is the goods balance: recorded exports of physical things minus recorded imports of them. Wider is the balance on goods and services together, which adds travel, transport, finance, licensing and the rest of what one country sells another without shipping it. Wider still is the current account, which adds investment income and transfers. The three move differently and are routinely swapped for one another in public argument.
The gap between them is not small. In the readings the Brief carries, the goods balance is a deficit of $1.3 trillion, while exports of services alone come to $1.2 trillion. Goods are counted at the border from customs declarations; services are estimated from surveys of firms. Different machinery, different revision histories, and one of the two is much easier to see.
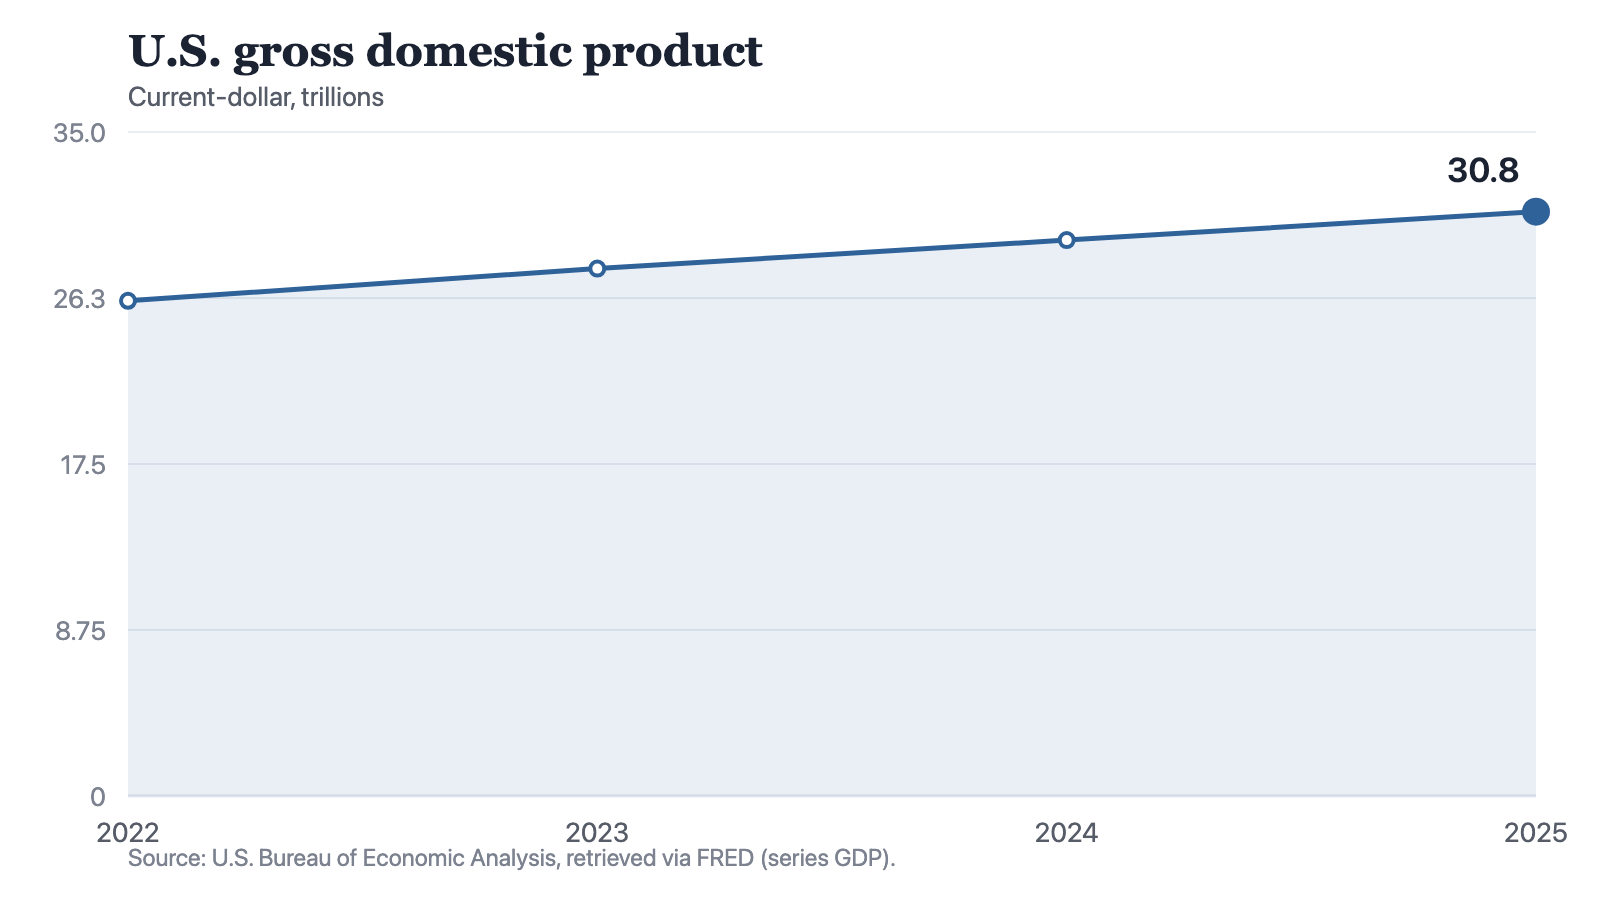
Notes: This chart is not a trade series and shows no balance. It is the denominator: the size of the economy against which a trade figure is being read. Source: U.S. Bureau of Economic Analysis, retrieved via FRED (series GDP).
Source: The Cefa Brief
Chart description
A line chart of four annual points in current-dollar trillions. The line rises in every year, from 26.1 in 2022 to 27.8 in 2023, 29.3 in 2024 and 30.8 in 2025. The steps are close to even, so the shape is a near-straight upward slope with no dip or flattening.
A line chart of four annual points in current-dollar trillions. The line rises in every year, from 26.1 in 2022 to 27.8 in 2023, 29.3 in 2024 and 30.8 in 2025. The steps are close to even, so the shape is a near-straight upward slope with no dip or flattening.
Scale is the reason the chart is here. Exports of goods and services together run at about 11 percent of gross domestic product in the latest reading. Most of what the United States produces, it sells to itself. A balance struck on the traded slice of an economy is a statement about that slice, not a verdict on the whole of it.
The entry on the other side
The balance of payments is double-entry bookkeeping, and this is the part most often left out. Dollars paid to foreign sellers do not vanish; they are held, spent on American goods, or used to buy American assets, which is why a deficit on the current account is matched by an inflow on the financial account. Treasury securities, corporate equity, real estate and factories are all on the other side of the entry. The two sides do not agree perfectly in practice, and the published gap between them has a name, the statistical discrepancy, precisely because compilers cannot observe everything.
What the balance moves with
- Domestic saving and investment: a country that invests more than it saves must import the difference in capital, and the trade account is where that shows up.
- The exchange rate: a stronger currency makes imports cheaper and exports dearer without anything changing in a factory.
- The cycle: when domestic demand is strong, imports rise, so deficits often widen in good years and narrow in recessions.
- Supply chains: a component that crosses a border several times is counted at full value each time, so gross trade flows overstate how much value each crossing added.
A trade balance nets nothing against costs and records no profit. It is a description of composition, not a result.
That last point is what makes the scoreboard reading wrong rather than merely incomplete. A company's loss means it spent more than it earned. A trade deficit means a country bought more goods than it sold and financed the difference by selling assets or borrowing. Whether that is prudent depends entirely on what the borrowing bought: productive capacity earns its keep, consumption does not. The balance itself does not distinguish between them.
Where the argument is
Economists divide on the direction of causation, and the division is real. One camp reads the trade balance as the mirror of domestic saving and investment decisions, which makes tariffs a poor instrument against it: restrict one import and the identity reasserts itself through the exchange rate or through another flow. The other camp argues that foreign policy choices, including managed currencies, subsidised production and closed procurement, push capital toward deficit countries and hollow out tradable sectors in them. Both accounts fit the aggregate data. They differ on what moves first.
When a deficit figure appears in front of you, three questions will tell you whether the person citing it understands it. Which balance is this, goods or goods and services or the current account? Over what period, and is the figure revised or provisional? And what was the matching entry on the financial account? A deficit quoted without its financing side is one half of an accounting identity, presented as a verdict.
About the author
Each author told us that for this piece they hold no interest a reader would think relevant.
Explainers are written and kept up to date by The Cefa Brief’s editors. An Explainer is background CEFA stands behind. It is not one author’s argument, and it is not a CEFA position on what anyone should do. If something here is wrong or out of date, write to applied@thecefa.org.
© 2026 Center for Economics & Foreign Affairs. To republish it, see our republication terms. Republishing
Share
The Cefa Brief · applied.thecefa.org/cefa-brief/how-the-trade-deficit-is-computed · Printed from the web edition