
Electronics output rose more in 2025 than in the three years before it combined
The computer and electronic product index added 8.5 points in 2025, against 8 points exactly across the three preceding years together, on a base where 2017 is 100. A narrower semiconductor index published on the same base added 21 points in that same year, and the file does not say how much of the broader move belongs to it.
by
Published 3 minute read

رسم توضيحي: The Cefa Brief
Computer and electronic product output took its largest step of the window in 2025. On a base where 2017 is 100, the readings run 105.7 in 2020, 110.3 in 2021, 117 in 2022, 116.6 in 2023, 118.3 in 2024 and 126.8 in 2025. The final step, 8.5 points, is larger than the three steps before it added together.
Year by year the series added 4.6 points, then 6.7, then gave back 0.4, then added 1.7, then added 8.5. The three steps into 2022, 2023 and 2024 come to 8 points exactly. A reader who stopped at the 2024 observation had a series that had travelled 1.3 points in two years.
Three readings that sat still
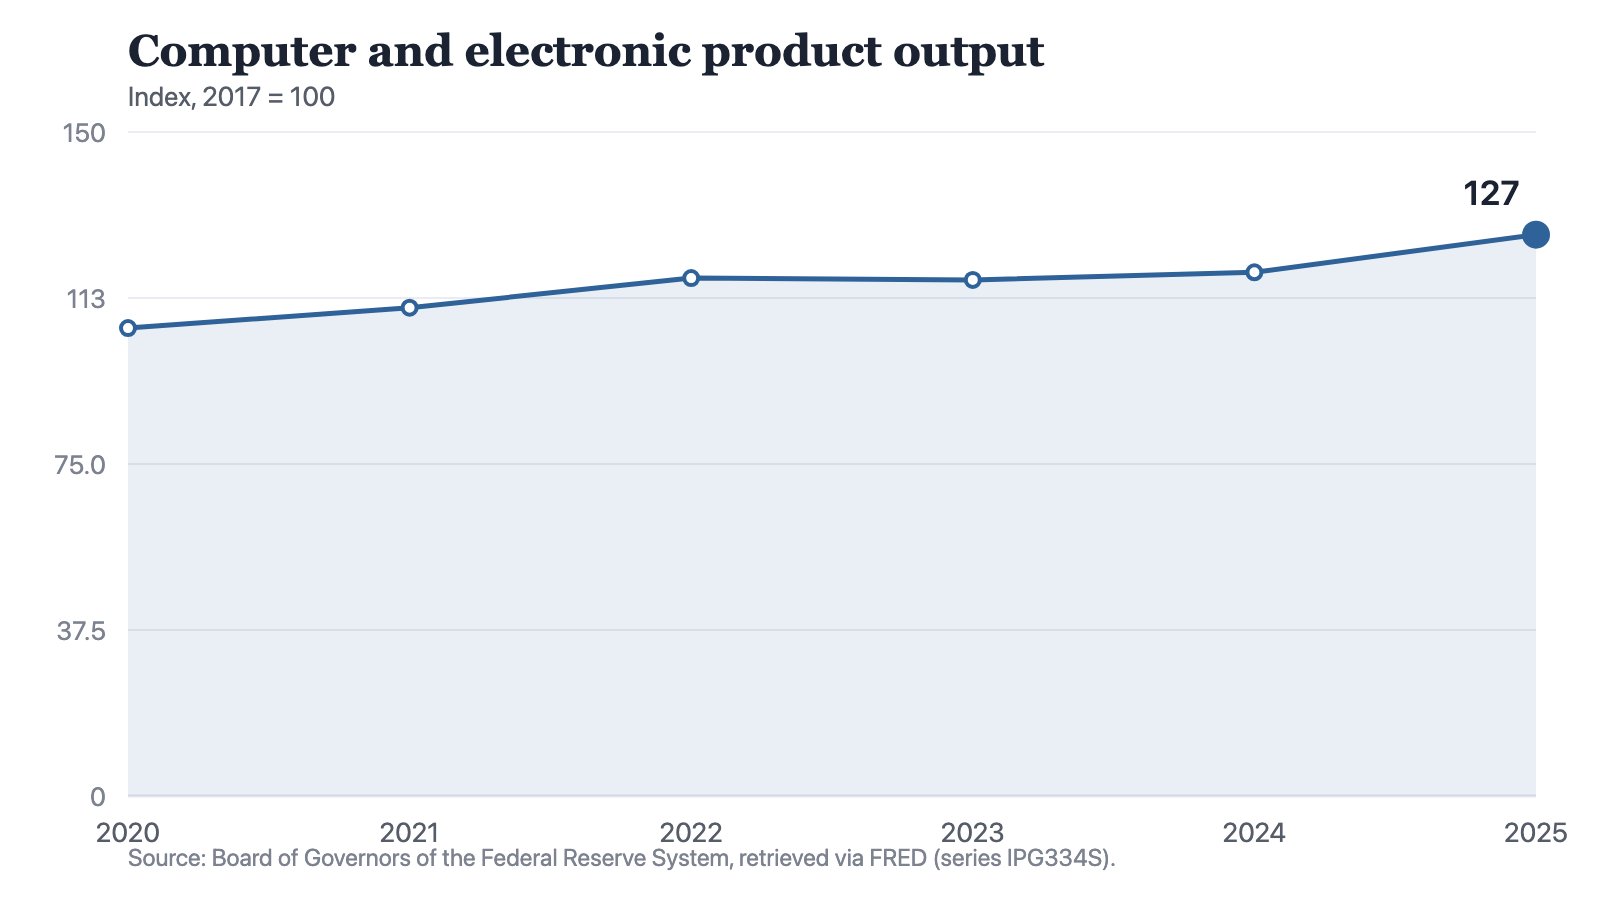
Notes: Annual observations of a production index. Each point is the average of the year's monthly readings, stated relative to 2017, and is not a quantity produced or a dollar value.
Source: The Cefa Brief
Chart description
A line chart of the computer and electronic product output index on a 2017 base of 100: 105.7 in 2020, 110.3 in 2021, 117 in 2022, 116.6 in 2023, 118.3 in 2024 and 126.8 in 2025. The line climbs to 2022, dips slightly in 2023, recovers a little in 2024, and takes its steepest step of the chart in 2025.
A line chart of the computer and electronic product output index on a 2017 base of 100: 105.7 in 2020, 110.3 in 2021, 117 in 2022, 116.6 in 2023, 118.3 in 2024 and 126.8 in 2025. The line climbs to 2022, dips slightly in 2023, recovers a little in 2024, and takes its steepest step of the chart in 2025.
The middle of the window is where the shape is. The index reached 117 in 2022, fell to 116.6 in 2023 and recovered to 118.3 in 2024. The whole spread of those three readings is 1.7 points, and the distance from the first of them to the last is 1.3 points across two years, less than the series covered in 2021 alone.
That flat middle is what makes the last observation legible. A line climbing steadily would make 8.5 points look like continuation. This one had all but stopped climbing. The step into 2025 does not extend a trend; it follows three readings that lie within 1.7 points of one another.
A narrower line on the same base
A second index from the same board is set to the same base year. U.S. semiconductor production reads 121 in 2021, 131 in 2022, 135 in 2023, 144 in 2024 and 165 in 2025. Over that span it added 44 points. Computer and electronic product output, measured from the same starting year, added 16.5.
Those two lines do not always move together. In 2023 the semiconductor index rose 4 points while the broader electronics index fell 0.4. In 2025 the semiconductor index rose 21 points and the broader one rose 8.5. Each of those 2025 moves is the largest single-year move its own series makes in this file, and both land in the same year.
Two indexes on a common base can be read side by side. They cannot be subtracted from one another without the weights, and the weights are not here.
What cannot be taken out of it
How much of the broader move the narrower line accounts for is the obvious next question, and this file does not answer it. It holds two published indexes and their annual values. It does not hold the weight the semiconductor series carries inside the electronics series, or state that it carries one. Without that weight the remainder cannot be computed, and an estimate of it would be a figure this publication does not have.
What a production index records is narrow in a second way. It records how much was made against 2017 and nothing else. A reading of 126.8 on a base of 100 puts 2025 output 26.8 percent above the 2017 level. It does not say which products, at which technology generation, with which imported inputs, or how many people were employed making them, and it does not say that the sector is more secure than it was.
The sentence the data supports is a plain one. Computer and electronic product output was close to flat for three readings and then rose 8.5 points in a single year, more than it had risen in the three years before it, while a narrower semiconductor index on the same base rose further still over the same span. Why it rose, what was made, and how much of the rise belongs to the narrower line are questions this file leaves open. Naming them costs less than being corrected on them later.
Method and data
The figures are the annual observations of computer and electronic product output, series IPG334S, published by the Board of Governors of the Federal Reserve System, redistributed by FRED and retrieved for this site on 19 September 2026. The series is an index with 2017 set to 100, so each reading states output relative to that year rather than a quantity, a dollar value or a share of anything. Each annual point is the average of the year's monthly readings, which is the conventional way to read an index and the reason no annual total appears anywhere in this piece. 2025 is the last complete calendar year held in the file.
The semiconductor figures are a separate published index, series IPG3344S, from the same board, retrieved on the same date and also set to 100 in 2017. The two series are set beside one another here only because they share that base year. The file does not state the weight the narrower series carries inside the broader one, or that it carries one, so nothing in this piece subtracts one index from the other or infers a residual. Neither index records capacity, technology generation, employment, ownership, or which stages of production took place in the country, and neither attributes any movement to any policy.
How to cite
Jag DeSaint, "Electronics output rose more in 2025 than in the three years before it combined," The Cefa Brief, Applied America, 19 يونيو 2025, https://applied.thecefa.org/cefa-brief/the-remainder-is-not-published.
About the author

Each author told us that for this piece they hold no interest a reader would think relevant.
This Insights piece carries its author's name because the view in it is the author's own. An editor reviewed it before publication, which is not the same as agreeing with it. It is not a position of the Center for Economics & Foreign Affairs or of Applied America.
© 2025. The author or authors hold the copyright in this Insights piece; CEFA publishes it with their permission. This edition, its editing and its presentation are © 2025 Center for Economics & Foreign Affairs. To republish it, see our republication terms. Republishing
Share
The Cefa Brief · applied.thecefa.org/cefa-brief/the-remainder-is-not-published · Printed from the web edition