
The institutions that match workers to work appear in no series that measures the match
Job openings averaged 11.2 million a month in 2022 and 7.1 million a month in 2025, and the quits rate ended the window at 2 percent of employment, under its 2020 reading. Prime-age participation finished at 83.6 percent, its highest, so whatever is weakening is not weakening everywhere the statistics look.
by
Vantage point
The vantage decides what follows, so it should be named before anything is argued from it. I am an analyst writing inside The Cefa Brief, working from published statistics and public documents and from nothing else: annual series redistributed by FRED and retrieved for this site on 19 September 2026, together with the Bureau of Labor Statistics occupational file for 2025. I hold no post in a labour ministry, no seat on a training board and no employer's hiring record. What that position sees is the counts the statistical agencies have chosen to publish, at the frequency they publish them, on a national or a state basis. What it does not see is a hiring decision, an application refused, a training place left unfilled or a licence withheld. None of these files records a meeting between a worker and an employer, and I will not pretend to read one out of an annual series.
Published 6 minute read

رسم توضيحي: The Cefa Brief
In 2022 American employers held 11.2 million unfilled posts on the monthly average. In 2025 they held 7.1 million. Across the same stretch the rate at which people quit a job fell from 2.8 percent of employment to 2, which is below where it stood in 2020. Both sides of the exchange grew quieter at once. Neither series says anything about what does the exchanging.
Where this is written from
The vantage decides what follows, so it should be named before anything is argued from it. I am an analyst writing inside The Cefa Brief, working from published statistics and public documents and from nothing else: annual series redistributed by FRED and retrieved for this site on 19 September 2026, together with the Bureau of Labor Statistics occupational file for 2025. I hold no post in a labour ministry, no seat on a training board and no employer's hiring record. What that position sees is the counts the statistical agencies have chosen to publish, at the frequency they publish them, on a national or a state basis. What it does not see is a hiring decision, an application refused, a training place left unfilled or a licence withheld. None of these files records a meeting between a worker and an employer, and I will not pretend to read one out of an annual series.
What a matching institution does
A labour market does not clear by itself. Four separate jobs have to be done by somebody, and they are done by institutions rather than by a price. Information has to travel, so that a post becomes known to a person who could fill it and a person's competence becomes legible to a stranger. Training has to be arranged and paid for before the work it prepares someone for exists. Risk has to sit somewhere other than on the worker, because a person with no income cannot search for long and will take the first thing offered. Permission has to be granted, through licences and credentials and their recognition across a state line, before a qualified person may lawfully do the work.
None of those four appears in the numbers this publication holds. There is no series here for apprenticeships registered, for placements made by a public employment service, for the share of job-losers drawing insurance, or for licences granted and recognised elsewhere. The files record the outcome of matching and not the machinery of it. That is the first structural fact, and it is a fact about this record rather than about the labour market: the institutions doing the work are the ones it does not count.
Both sides of the market thinned at once
Openings ran at 6.3 million on the monthly average in 2020, then 10, 11.2, 9.3, 7.7 and 7.1 million. Each point is an average of that year's months and not a year's total. The fall from the 2022 peak is 4.1 million, and the 2025 reading is still 0.8 million above 2020. Measured against the size of the job base that comfort shrinks. Dividing openings by nonfarm payroll employment, two series from the same agency and both in millions, gives 4.43 openings per 100 payroll jobs in 2020, then 6.84, 7.34, 5.97, 4.88 and 4.48. The 2025 figure stands 0.05 above the 2020 figure and 2.86 below the 2022 peak. That quotient is arithmetic performed here and is not the job openings rate the Bureau publishes.
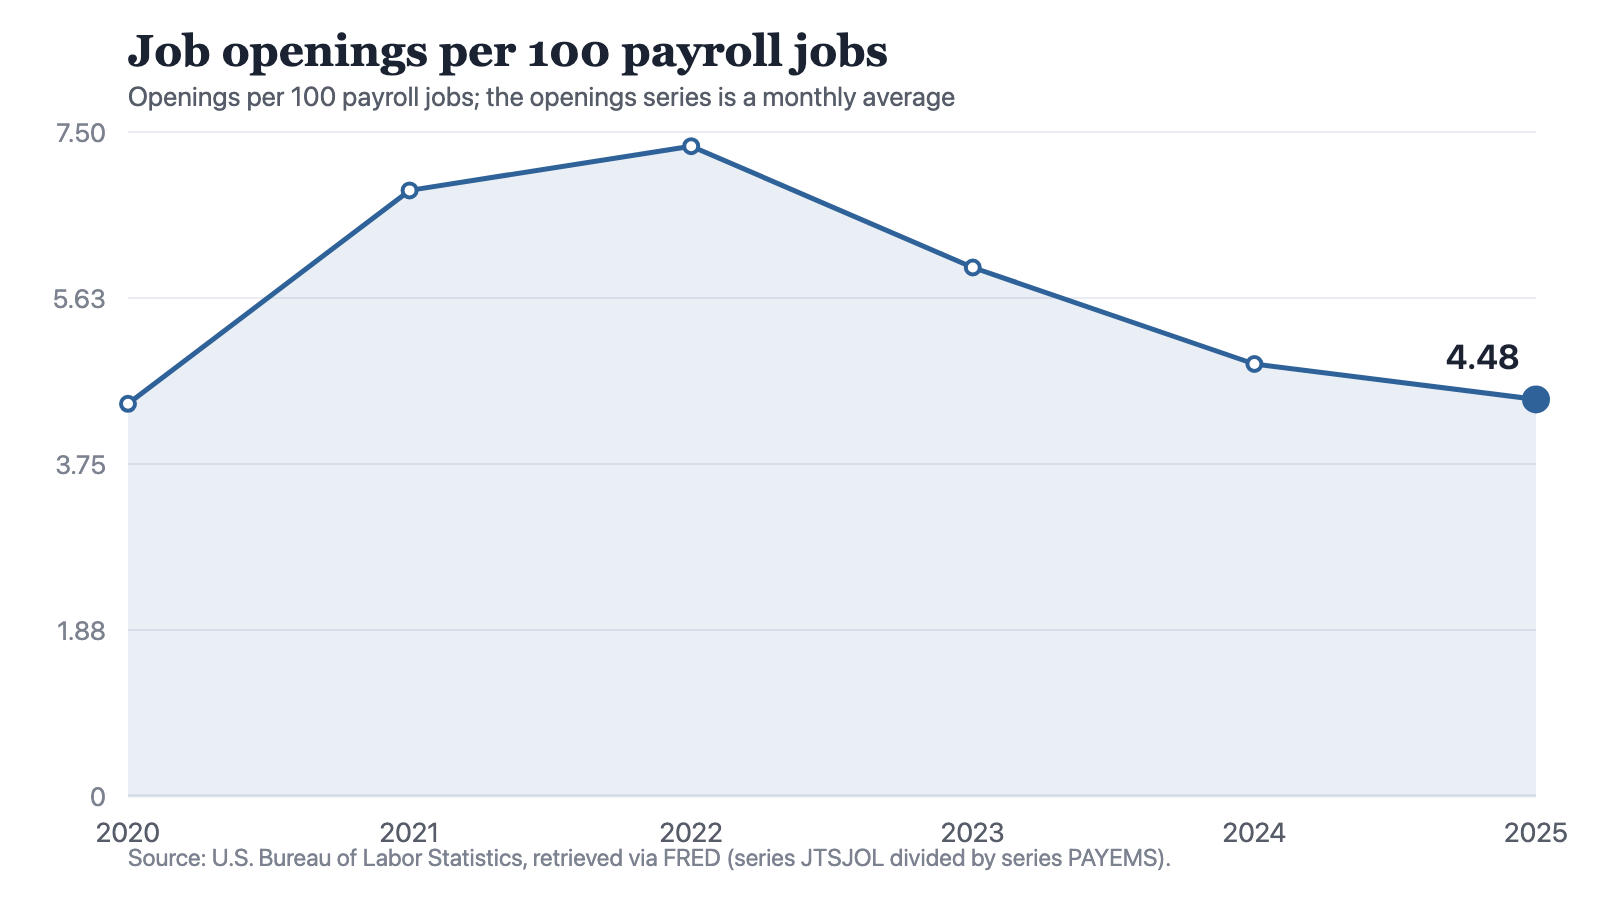
Notes: Job openings (series JTSJOL, millions of openings at a monthly average) divided by total nonfarm payroll employment (series PAYEMS, millions of jobs), both U.S. Bureau of Labor Statistics, retrieved 19 September 2026, and multiplied by 100. Each openings point is a monthly average and not a yearly total. The six figures are arithmetic on published series, not a published series, and are not the Bureau's own job openings rate.
Source: The Cefa Brief
Chart description
A line chart of job openings per 100 payroll jobs: 4.43 in 2020, 6.84 in 2021, 7.34 in 2022, 5.97 in 2023, 4.88 in 2024 and 4.48 in 2025. The line climbs steeply through 2021 to the 2022 peak of 7.34, then falls in each of the three years that follow, ending at 4.48, which is 0.05 above the 2020 reading of 4.43.
A line chart of job openings per 100 payroll jobs: 4.43 in 2020, 6.84 in 2021, 7.34 in 2022, 5.97 in 2023, 4.88 in 2024 and 4.48 in 2025. The line climbs steeply through 2021 to the 2022 peak of 7.34, then falls in each of the three years that follow, ending at 4.48, which is 0.05 above the 2020 reading of 4.43.
Quitting is a judgement about the machinery
A worker who resigns is making a claim about institutions. The claim is that a better match exists, that it can be found, and that the interval between the two jobs is survivable. Where that confidence is present the quits rate rises; where it is absent people stay where they are, whatever they think of the work. The series runs 2.1 percent of employment in 2020, then 2.7, 2.8, 2.4, 2.1 and 2. It has fallen in each of the last three readings and now sits 0.1 points below its reading for 2020, the year in which the unemployment rate read 8.1 percent, the highest of its six readings. Average hourly earnings rose at every step across those six years, from 29.36 dollars an hour in 2020 to 36.44 in 2025. Hourly pay went up in cash terms, before any adjustment for prices, while movement inside the market went down, and nothing on this site reconciles the two.
A resignation is a bet on institutions. When people stop making it, those institutions are the first thing to examine and the last thing anyone counts.
The objection with real force
The reply worth taking seriously is that 2022 was the anomaly and everything since is an ordinary market returning. Two pieces of evidence support it, and both are strong. Prime-age participation, measured against the 25 to 54 population, rose from 81.4 percent in 2020 to 83.6 in 2024 and held at 83.6 in 2025, the highest pair of readings in the window; a matching system in decline does not usually pull more people of working age into the labour force. The second is harder. Broad underemployment has risen from 6.9 percent of the labour force in 2023 to 8 in 2025 while the headline rate rose from 3.6 to 4.3, which is 1.1 points against 0.7 and looks like a widening. As a multiple it is not one. The broad rate stood at 1.86 times the headline rate in 2022, 1.92 times in 2023 and 1.86 times in 2025, to two decimal places, so across the same 2023 to 2025 interval the multiple narrowed rather than widened. A difference counted in points widens on its own when both rates rise from a low base. On the test that controls for that, the quality of the match has not deteriorated relative to its quantity, and the argument here has to stand without that support.
A match is made in a place
National series describe an average no worker inhabits. The occupational file for 2025 covers 51 jurisdictions and holds, for each, 22 major occupational groups and 12 local specialities; the median wage across all occupations runs from 91,540 dollars in the District of Columbia to 40,120 in Mississippi, a spread of 51,420 dollars. The file's own measure of concentration, the location quotient, is an occupation's share of a state's jobs divided by its share of national jobs, so a reading above 1 marks work more concentrated there than in the country as a whole. A vacancy in the national total is reachable only by somebody who can travel to it, is permitted to do it, and can afford the interval. Licensing, recognition and the cost of moving are decided locally. The count that describes the market is not.
What weakness looks like, and what would settle it
Weak matching institutions do not produce a collapse. They produce a market that moves less: fewer posts relative to the job base, fewer people leaving work they can do for work they would do better, and adjustment falling on whoever is least protected rather than on whoever is best placed. The record assembled here is consistent with that description and does not establish it, because six annual points cannot separate a weakened institution from a calm market. What would settle it is a count of the machinery instead of the outcome. Registrations completed, placements made, the share of job-losers actually drawing insurance, licences recognised across a border: four series, published annually, on the same footing as the vacancy count. Until a record of that kind sits beside the vacancy count, an argument of this kind can be made carefully and cannot be closed, and a government deciding what to spend on matching people to work is choosing in the part of its labour policy these statistics do not describe.
How to cite
Jag DeSaint, "The institutions that match workers to work appear in no series that measures the match," The Cefa Brief, Applied America, 7 أكتوبر 2026, https://applied.thecefa.org/cefa-brief/the-market-does-not-do-the-matching.
About the author

Each author told us that for this piece they hold no interest a reader would think relevant.
This Perspectives piece carries its author's name because the view in it is the author's own. An editor reviewed it before publication, which is not the same as agreeing with it. It is not a position of the Center for Economics & Foreign Affairs or of Applied America.
© 2026. The author or authors hold the copyright in this Perspectives piece; CEFA publishes it with their permission. This edition, its editing and its presentation are © 2026 Center for Economics & Foreign Affairs. To republish it, see our republication terms. Republishing
Share
The Cefa Brief · applied.thecefa.org/cefa-brief/the-market-does-not-do-the-matching · Printed from the web edition