
Retail sales rose in every year of the window, counted in dollars
The monthly rate went from 601.2 billion dollars in 2021 to 724.4 in 2025 with no down year. The largest single-year rise landed in the same year as the largest rise in the price level.
by
Published 2 minute read

رسم توضيحي: The Cefa Brief
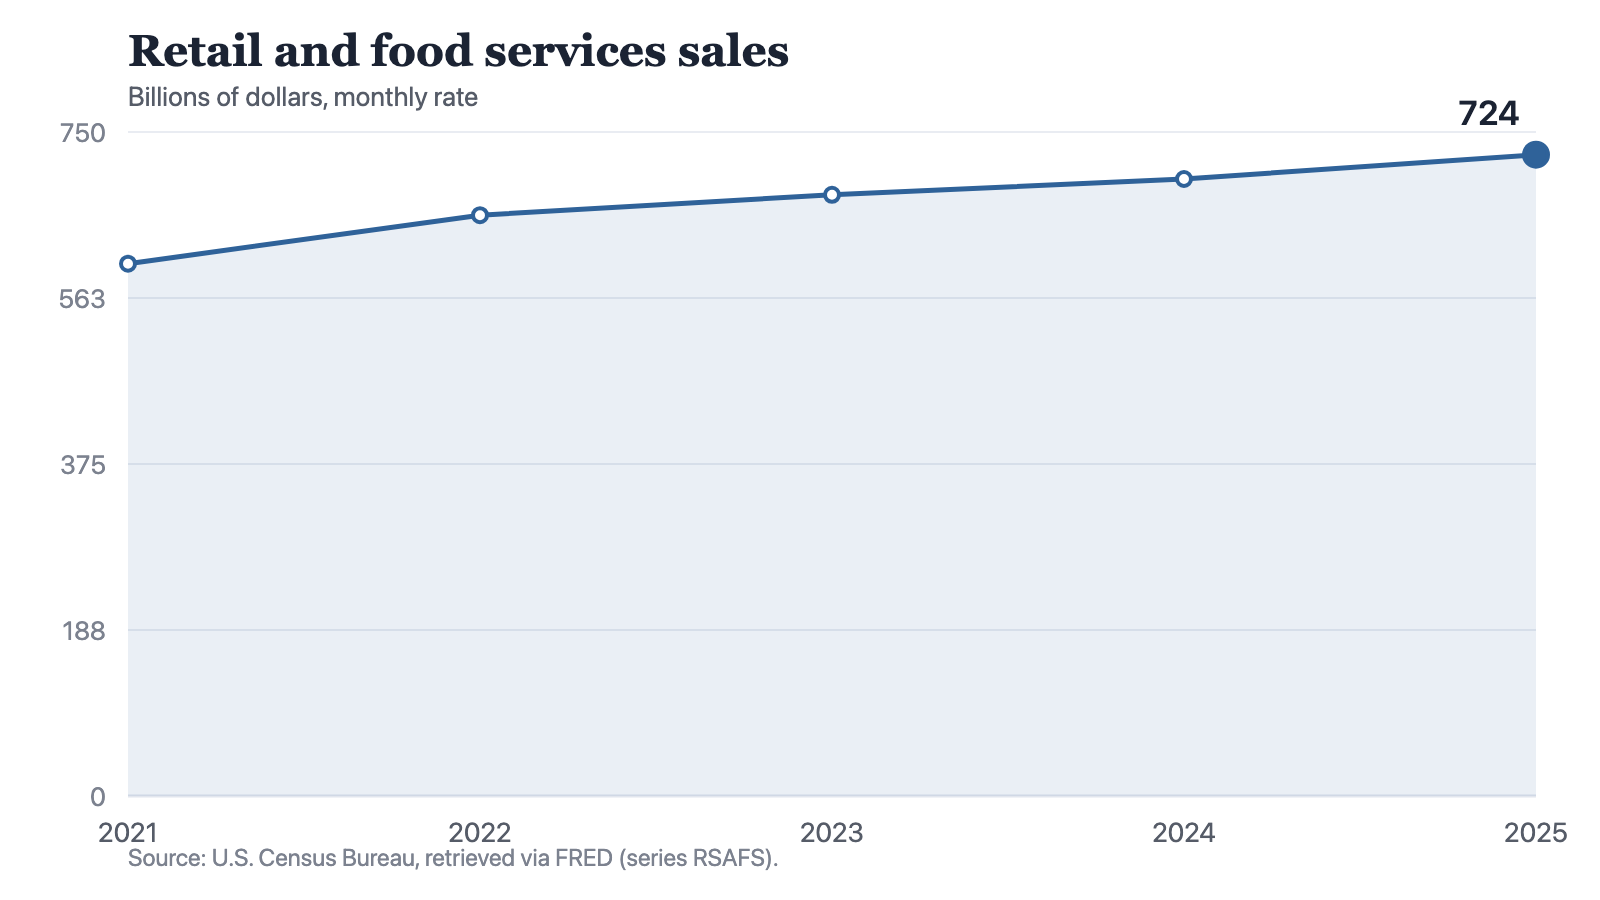
Retail and food services sales have risen in every year of the available window. The monthly rate went from 601.2 billion dollars in 2021 to 724.4 billion in 2025, an increase of 123.2 billion. There is no down year in the series.
The five readings are 601.2 in 2021, 656 in 2022, 679.1 in 2023, 696.9 in 2024 and 724.4 in 2025, all in billions of dollars at a monthly rate.
The increments, not the level
Year on year the series added 54.8 billion, then 23.1, then 17.8, then 27.5. The first step is almost exactly twice the largest of the three that followed it. The slowest year in the window is 2024, at 17.8 billion, and the most recent year is faster than the two before it while still adding only half of what the first year added.
Notes: Annual observations. Each point is a monthly rate, not an annual total, and the series is stated in dollars without adjustment for prices.
Source: The Cefa Brief
Chart description
A line chart showing sales at 601.2 billion dollars a month in 2021, 656 in 2022, 679.1 in 2023, 696.9 in 2024 and 724.4 in 2025. The line rises at every step, with the steepest section between 2021 and 2022 and the shallowest between 2023 and 2024.
A line chart showing sales at 601.2 billion dollars a month in 2021, 656 in 2022, 679.1 in 2023, 696.9 in 2024 and 724.4 in 2025. The line rises at every step, with the steepest section between 2021 and 2022 and the shallowest between 2023 and 2024.
A line that only goes up invites the conclusion that consumption has been strong throughout. The increments say something more specific: one very large year at the front, two slow years in the middle, and a partial pick-up at the end. The level tells you where the series is. The increments tell you what has been happening to it.
The same year, in a different series
The largest retail step and the largest move in the consumer price level fall in the same year. Consumer prices, on a 1982-84 base of 100, run 258.9, 271, 292.6, 304.7, 313.7 and 322 across 2020 to 2025. The step into 2022 is 21.6 index points, the largest of that window, and the step into 2022 in retail sales is 54.8 billion, the largest of its own.
Those are two separate series and I have not divided one by the other. Nothing here computes real retail sales, and no one should read this paragraph as though it did. What it does is place the largest nominal jump in the same year as the largest jump in the price level, and leave the reader holding both facts at once.
A sales series measured in dollars rises when people buy more and when the same basket costs more. The line does not distinguish.
What the series counts
Two things about the measure itself. It is stated at a monthly rate, so each point is a monthly figure rather than a yearly total, and reading 724.4 billion dollars as a year's takings would be wrong by roughly a factor of twelve. And it counts what its title says it counts, retail and food services. Household spending that is neither sits outside it.
That second point matters for anyone using this series as a stand-in for the consumer. It is a good measure of goods bought and meals eaten out. It is not a measure of what households spend, and the gap between those two things is not small.
The most defensible sentence about this series is also the dullest. Retail and food services sales, in dollars, went up every year since 2021, and the year they went up most was the year prices went up most. Anything beyond that needs a series this brief does not hold, and I would rather name the limit than write past it.
Method and data
The figures are annual observations of retail and food services sales, series RSAFS, published by the U.S. Census Bureau, redistributed by FRED and retrieved for this site on 19 September 2026. They are stated in billions of dollars at a monthly rate, so each point is a monthly figure and not an annual total. The series is not adjusted for prices and covers what its title names, retail and food services, rather than all household spending. The consumer price index quoted in the text is a separate series from a separate agency; it is named for context and is not used here to deflate anything, and nothing in this piece is a real sales figure.
How to cite
Jag DeSaint, "Retail sales rose in every year of the window, counted in dollars," The Cefa Brief, Applied America, 29 يناير 2025, https://applied.thecefa.org/cefa-brief/retail-sales-never-fell.
About the author

Each author told us that for this piece they hold no interest a reader would think relevant.
This Insights piece carries its author's name because the view in it is the author's own. An editor reviewed it before publication, which is not the same as agreeing with it. It is not a position of the Center for Economics & Foreign Affairs or of Applied America.
© 2025. The author or authors hold the copyright in this Insights piece; CEFA publishes it with their permission. This edition, its editing and its presentation are © 2025 Center for Economics & Foreign Affairs. To republish it, see our republication terms. Republishing
Share
The Cefa Brief · applied.thecefa.org/cefa-brief/retail-sales-never-fell · Printed from the web edition