
Two thirds of the M2 increase since 2020 arrived in a single year
The money stock is 4.26 trillion dollars larger than in 2020. Of that, 2.84 trillion came between 2020 and 2021, and the four years since have added half as much again, including the only contraction in the window.
by
Published 3 minute read

رسم توضيحي: The Cefa Brief
The M2 money stock is 21.96 trillion dollars in the most recent observation and was 17.7 trillion in 2020. The gap between those two numbers is 4.26 trillion dollars. Where that gap came from is more interesting than its size.
It came, two thirds of it, from one year. Between 2020 and 2021 the stock rose 2.84 trillion dollars, to 20.54 trillion. The four annual changes that followed net to 1.42 trillion, exactly half of that first move.
One year, then four much quieter ones
After 2021 the series slows sharply. It adds 1.07 trillion to 2022, reaching 21.61 trillion. Then it falls, by 0.74 trillion, to 20.87 trillion in 2023. Then it adds 0.26 trillion to 2024 and 0.83 trillion to 2025.
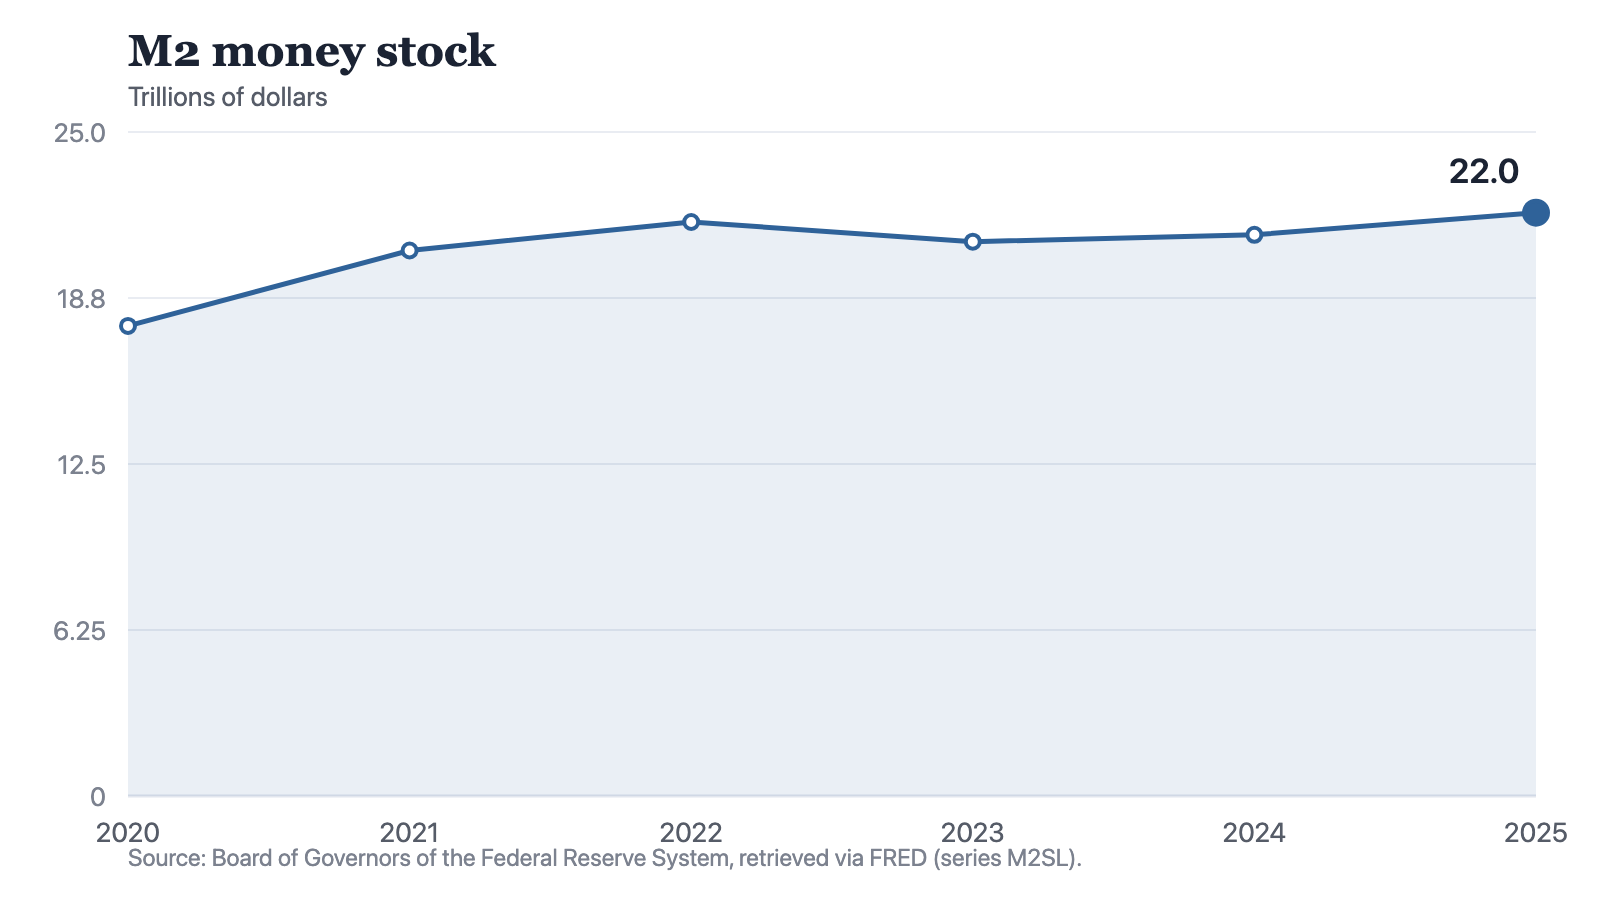
Notes: A balance, not a flow, and in current dollars. The single decline between 2022 and 2023 is the only one in the window. The 2025 observation averages the periods available at retrieval.
Source: The Cefa Brief
Chart description
A line chart of the M2 money stock showing 17.7 trillion dollars in 2020, a steep rise to 20.54 trillion in 2021, a smaller rise to 21.61 trillion in 2022, a fall to 20.87 trillion in 2023, and then recovery through 21.13 trillion in 2024 to 21.96 trillion in 2025. The only downward segment is between 2022 and 2023, and the 2025 value is the highest in the window.
A line chart of the M2 money stock showing 17.7 trillion dollars in 2020, a steep rise to 20.54 trillion in 2021, a smaller rise to 21.61 trillion in 2022, a fall to 20.87 trillion in 2023, and then recovery through 21.13 trillion in 2024 to 21.96 trillion in 2025. The only downward segment is between 2022 and 2023, and the 2025 value is the highest in the window.
That 2023 figure is the only decline in the six observations. It is also the reason the recent history of this series is so often described wrongly. The stock did not merely grow more slowly. For one annual observation it was smaller than the year before.
The scale difference between the first move and everything since is hard to overstate. Between 2022 and 2025 the stock went from 21.61 to 21.96 trillion dollars, a net 0.35 trillion across three annual changes. The single move from 2020 to 2021 was 2.84 trillion, more than eight times as large. One observation in this window behaves like a different series from the other five.
It took three observations to get back above the 2022 peak
The 2022 average of 21.61 trillion dollars stood as the high water mark of this window for two further observations. The 2023 average of 20.87 trillion is below it. So is the 2024 average of 21.13 trillion. Only the 2025 average of 21.96 trillion clears it.
In other words, three annual observations passed in which the money stock, measured in current dollars, was no larger than it had already been. For a series routinely described as expanding without limit, that is a plain contradiction sitting in the published record.
It cuts the other way too. Anyone who read the 2023 contraction as the start of a sustained reduction was reading a single observation as a trend. The stock resumed rising in the very next one, and by 2025 it was 0.35 trillion dollars above the previous peak.
What the series does not say
It does not say what the money did. A money stock is a balance held; it is not spending, not credit extended and not output. The relationship between this series and prices, activity or anything else is a claim requiring other evidence, and nothing in these six figures supplies it.
The annual averaging hides more here than it would in a rate series. These are averages of a monthly measure, so the contraction recorded at the 2023 observation has no date attached to it. The file cannot say in which months the stock fell, how far down it went at the lowest point, or when it turned. A reader who wants the timing of that episode will not find it in these six numbers and should not infer it from them.
It also does not say anything about purchasing power. These are current-dollar totals. A stock that is larger in dollars may command more, less or the same in goods, and this series is silent on which.
What it does establish is the shape of the last six years: one very large expansion, a long pause, one contraction, and a return to a level only modestly above where the pause began. Any account of monetary conditions since 2020 that skips over the middle four observations is describing the first year and calling it the period.
Method and data
The figures are annual averages of the M2 money stock, published by the Board of Governors of the Federal Reserve System and redistributed by FRED, retrieved for this site on 19 September 2026, and recorded in this publication's data file in trillions of dollars.
M2 is a balance, not a flow. It is the size of a stock of money at a point in time, averaged here over the year. It is not spending, not lending and not income.
The totals are in current dollars and are not adjusted for the price level, so an increase in the stock is not by itself an increase in purchasing power.
What counts toward M2 is defined by the publisher and that definition has been revised historically. Comparisons far outside this window should not be made from these six observations.
The 2025 observation averages the periods available at retrieval and is not a full-year figure. All differences quoted are arithmetic differences between the published annual averages.
How to cite
Jag DeSaint, "Two thirds of the M2 increase since 2020 arrived in a single year," The Cefa Brief, Applied America, 22 سبتمبر 2026, https://applied.thecefa.org/cefa-brief/m2-one-year-and-one-contraction.
About the author

Each author told us that for this piece they hold no interest a reader would think relevant.
This Insights piece carries its author's name because the view in it is the author's own. An editor reviewed it before publication, which is not the same as agreeing with it. It is not a position of the Center for Economics & Foreign Affairs or of Applied America.
© 2026. The author or authors hold the copyright in this Insights piece; CEFA publishes it with their permission. This edition, its editing and its presentation are © 2026 Center for Economics & Foreign Affairs. To republish it, see our republication terms. Republishing
Share
The Cefa Brief · applied.thecefa.org/cefa-brief/m2-one-year-and-one-contraction · Printed from the web edition