
The binding constraint on American port throughput sits inland, not at the berth
The occupational file puts the three heaviest concentrations of transport and material-moving work in Kentucky, Tennessee and Indiana, none of which fronts an ocean, and puts California, Florida and New York below the national share. No series held here counts a container, a berth or a crane, so the inland reading is an inference from where the work is counted.
by
Published 5 minute read

رسم توضيحي: The Cefa Brief
Every few years the country rediscovers its ports, and the argument that follows is conducted about the water. Berth counts, channel depth, cranes, the line of ships at anchor. That argument is aimed at the wrong end of the chain. The constraint on how much cargo the United States can actually absorb sits inland, in the yards, trucks and warehouses that take a box away from a terminal, and the clearest evidence in the published data is the map of where that work is counted.
For each of 51 jurisdictions the Bureau of Labor Statistics occupational file for 2025 publishes the share of that state's jobs held by Transportation and Material Moving Occupations, set against the same group's share of national jobs. Above one means more concentrated than the nation. The three highest readings in the country are 1.28, and they belong to Kentucky, Tennessee and Indiana. Georgia follows at 1.22, then New Jersey and Mississippi at 1.2. None of the first three fronts an ocean.
Where the work is not
Four states whose ports carry most of that argument sit on the other side of the line. Washington reads 0.96, California 0.94, Florida 0.93 and New York 0.75. California employs 1,504,070 people in the group, more than any other state and more than four times Indiana's 359,500, and it is still less concentrated in that work than the nation as a whole. Size and specialisation are different facts. The port debate has been conducted almost entirely on the first.
Just under half the country sits above the line, which is worth saying before anyone reads this as a league table. Twenty-five of the 51 jurisdictions carry a quotient of 1.00 or higher; 24 are strictly above it and Delaware sits exactly on it. The breadth does not disturb the ordering, and the ordering is the argument. Nor does the line follow the coast. Georgia reads 1.22 and New Jersey 1.2, both plotted above it here and both fronting an ocean, and Mississippi, Alabama, Louisiana, Texas, North Carolina and South Carolina stand above it as well. The table does not separate coast from interior. It separates the four gateway states the congestion argument names from the states most concentrated in moving goods, and the three at the top of that second group are landlocked.
The same file goes one level down. It names, for each state, the twelve detailed occupations that state is most concentrated in among those employing at least 1,000 people there. New Jersey's twelve include Packers and Packagers, Hand: 71,260 people, a location quotient of 4.62, 16.628 jobs for every 1,000 in the state, at an annual median of 43,840 dollars. That is a warehouse occupation, and it appears on the list of a state whose port is a standing item in every congestion discussion. No crane operator appears on it. No longshore, stevedore or dock occupation appears on any of the 51 lists. Water transport does appear elsewhere in the file: Louisiana's twelve carry Sailors and Marine Oilers at a quotient of 19.23 and Captains, Mates, and Pilots of Water Vessels at 14.89, and Virginia's carry Ship Engineers at 6.53. Those occupations crew vessels. The work done on a quay is named nowhere.
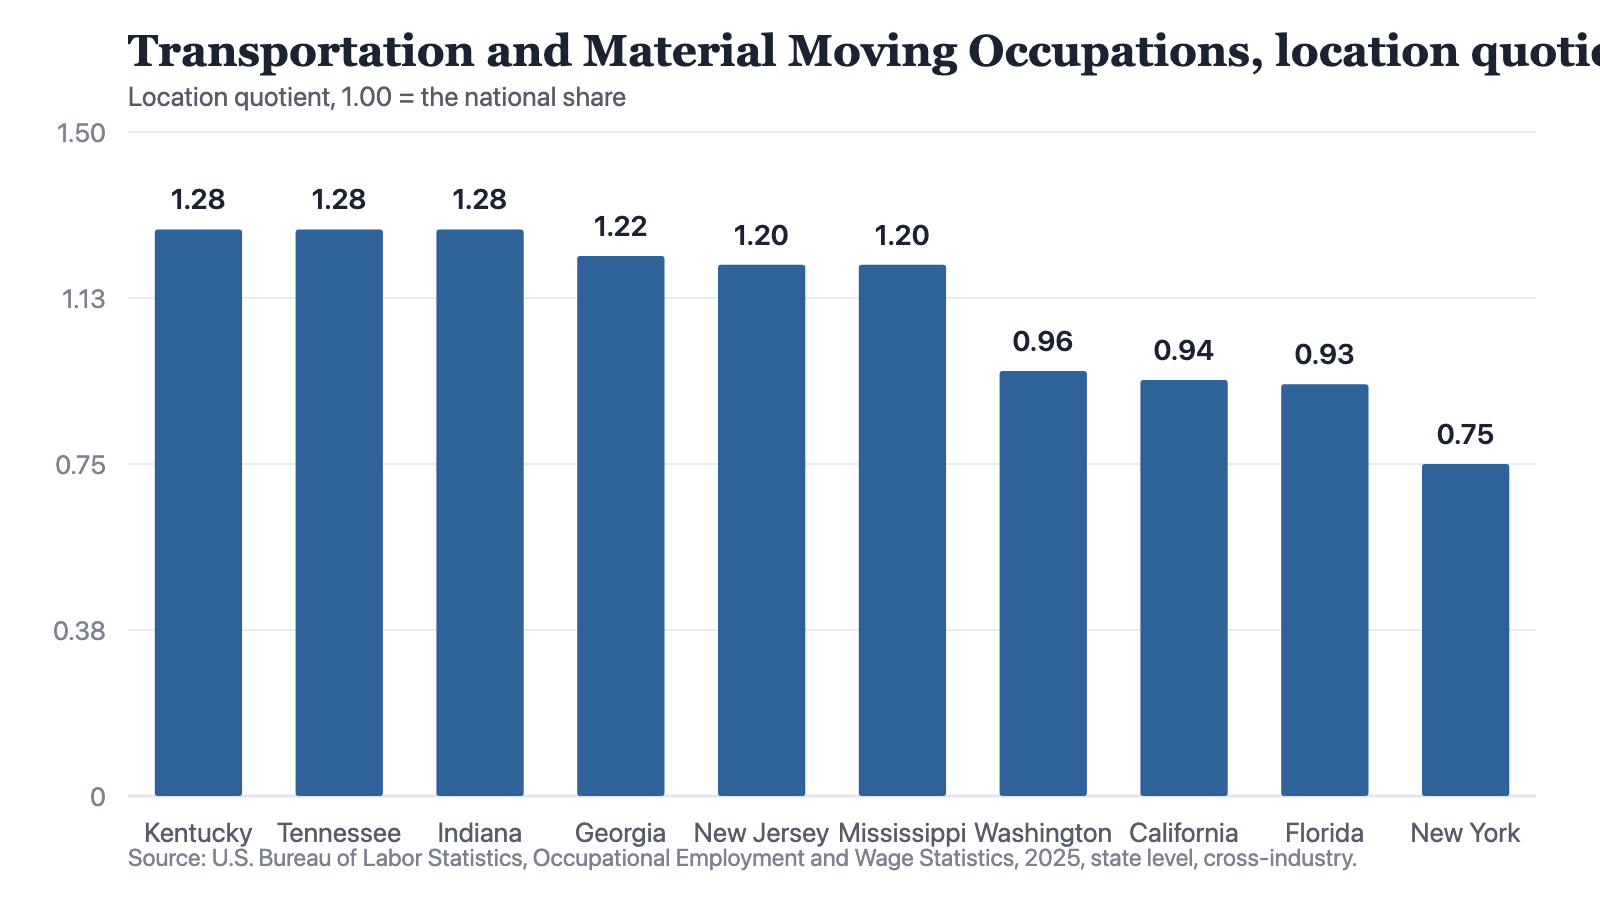
Notes: Ten of 51 jurisdictions: the six highest location quotients in the country, then four coastal states named in the port debate. The other 41 are not plotted; their values run from 1.18 down to 0.3. The quotient is published by the Bureau and is not calculated here.
Source: The Cefa Brief
Chart description
A bar chart of ten jurisdictions. Kentucky, Tennessee and Indiana each stand at 1.28, Georgia at 1.22, New Jersey at 1.2 and Mississippi at 1.2, all above the 1.00 line. Washington stands at 0.96, California at 0.94, Florida at 0.93 and New York at 0.75, all below it. The gap between the lowest bar in the upper group, 1.2, and the highest in the lower group, 0.96, is 0.24, and nothing is plotted between them: the 41 jurisdictions not shown hold values from 1.18 down to 0.3, and those falling inside the gap are among them.
A bar chart of ten jurisdictions. Kentucky, Tennessee and Indiana each stand at 1.28, Georgia at 1.22, New Jersey at 1.2 and Mississippi at 1.2, all above the 1.00 line. Washington stands at 0.96, California at 0.94, Florida at 0.93 and New York at 0.75, all below it. The gap between the lowest bar in the upper group, 1.2, and the highest in the lower group, 0.96, is 0.24, and nothing is plotted between them: the 41 jurisdictions not shown hold values from 1.18 down to 0.3, and those falling inside the gap are among them.
What the data cannot do
None of this counts a container. The files cited here hold no port, no terminal, no berth, no vessel call, no coastal split and no throughput figure of any kind. Nonresidential construction spending arrives as one undifferentiated line, 1,309 billion dollars at a seasonally adjusted annual rate in 2025, which is a yearly rate and not a month's spending, and nothing inside it names a wharf. The occupational file records occupations rather than employers, so a warehouse worker inside a terminal gate and one in an inland county are the same row.
Absence from a top-twelve is not absence from the economy, and the missing crane operator is a property of how the list is built. An occupation too small in a state, or too evenly spread across all of them, cannot reach a speciality list however important it is at a quayside. I am reading what the file shows and naming what it does not, and the honest form of the inland claim is that it is an inference from where the work is counted, not a measurement of what any port can move.
The three states most specialised in moving goods do not front an ocean. That is the argument, and it is one table wide.
The total kept rising and changed its address
Two flow series are worth holding beside the workforce map. Imports of goods and services rose from 3.97 trillion dollars in 2022 to 4.25 trillion in 2025, an increase of 0.28 trillion, about 7 percent. Total business inventories, stated as a monthly average in billions of dollars, went from 2,490 to 2,663 across the same three years, an increase of 173 billion, also about 7 percent. Those are a flow and a stock in different units; only the two growth rates are being compared. The country took in more and held more, in close to the same proportion.
Origin is what moved sharply. Goods imports from China, stated as a monthly average, ran 45 billion dollars in 2022 and 26 billion in 2025, a fall of 19 billion, or 42 percent. The series is a value and not a count, so what shrank by 42 percent is the average month's China bill; it does not follow that 42 percent fewer boxes arrived. The total did not shrink with it. No series held here says what filled the gap, over which water, into which gateway.
A national capacity story cannot survive that. If one trade lane can lose 42 percent of its value in three years while the total rises, then the pressure on any particular gateway is set by routing decisions taken elsewhere, not by a national quantity of berth. The quantity that matters is local, and it is the local landside network, which takes longer to build than a crane and is staffed by the group this file maps.
Berths and channels are not unimportant. The claim is narrower and harder: the case for spending on them cannot be made from the numbers the federal statistical system publishes at national level, and those numbers point somewhere else. A port authority can count its own lifts and should. A minister or an allocator reading national data cannot, and ought not to be handed a national capacity story built on a measure nobody has published.
I would rather state the position and its limit in the same breath. The constraint sits inland. The evidence is the occupational geography of 51 jurisdictions and two import series, one rising in total value while the other fell by 42 percent. The thing that would settle it, a published count of containers moved by port by year, is in none of the files this brief holds. Anyone arguing otherwise from national statistics is reasoning from a proxy and owes the reader its name.
About the author

Each author told us that for this piece they hold no interest a reader would think relevant.
This commentary carries its author's name because the view in it is the author's own. An editor reviewed it before publication, which is not the same as agreeing with it. It is not a position of the Center for Economics & Foreign Affairs or of Applied America.
© 2026. The author or authors hold the copyright in this commentary; CEFA publishes it with their permission. This edition, its editing and its presentation are © 2026 Center for Economics & Foreign Affairs. To republish it, see our republication terms. Republishing
Share
The Cefa Brief · applied.thecefa.org/cefa-brief/hand-packers-not-crane-operators · Printed from the web edition