
A national credential is built for a job market no state actually has
The Bureau's 2025 occupational file lists twelve local specialities for each of 51 jurisdictions, 612 rows holding 351 different occupations, and 204 of those appear on exactly one state's list. The same file records no credential at all, so an employer certificate would have to publish numbers a stranger can count before it could replace the system it criticises.
by
Published 5 minute read

Иллюстрация: The Cefa Brief
The credential argument is nearly always conducted as an argument about volume. Too few people trained for the work that needs doing, or too many trained for work that does not. I think the framing is wrong, and the occupational file the Bureau of Labor Statistics publishes each year is the clearest evidence available that it is wrong. A credential is issued once, against a national picture of work. The demand it has to satisfy is fifty-one separate structures, and the Bureau's own concentration measure shows how little those structures hold in common.
Begin with the part of the file built to answer the question of what a state is unusually full of. For each of the 51 jurisdictions the 2025 file names the twelve detailed occupations in which that state is most concentrated, among occupations employing at least 1,000 people there. That is 612 rows. They contain 351 different occupations, and 204 of those appear on exactly one state's list. The most widely shared entry in the entire set is Highway Maintenance Workers, which reaches eight lists out of fifty-one. Short lists usually repeat; this one does not. Most of what makes a state's labour demand distinctive is distinctive to that state and to no other.
The credentialled case, taken on its own terms
Consider the occupational group the credential argument is loudest about. Computer and Mathematical Occupations is my choice of test case and not the file's, because nothing in the data records what qualification anybody holds. Across the 51 jurisdictions the group employs 5,260,080 people, which is 3.38 percent of the 155,495,750 jobs the same file counts across them. Eight jurisdictions hold 2,711,110 of them, or 51.54 percent: California, Texas, New York, Florida, Virginia, Washington, North Carolina and Illinois, in that order, are more than half of the whole.
Alongside each group the Bureau publishes a location quotient, defined in the file as the occupation's share of that state's jobs divided by its share of national jobs. Above one means more concentrated than the nation. For computer and mathematical work, 38 of the 51 jurisdictions sit below one and thirteen sit at or above it. In 38 places the work the credential is aimed at is a smaller part of local employment than it is of national employment.
Density states the same point in the units a hiring manager would use. Washington holds 67.509 computer and mathematical jobs for every thousand jobs in the state. Louisiana holds 13.609, a factor of 4.96 between two labour markets operating under one national idea of what the qualification is worth. Pay varies as well, over a narrower range: the group's median runs from 75,000 dollars in Mississippi to 138,670 in California, a gap of 63,670 dollars.
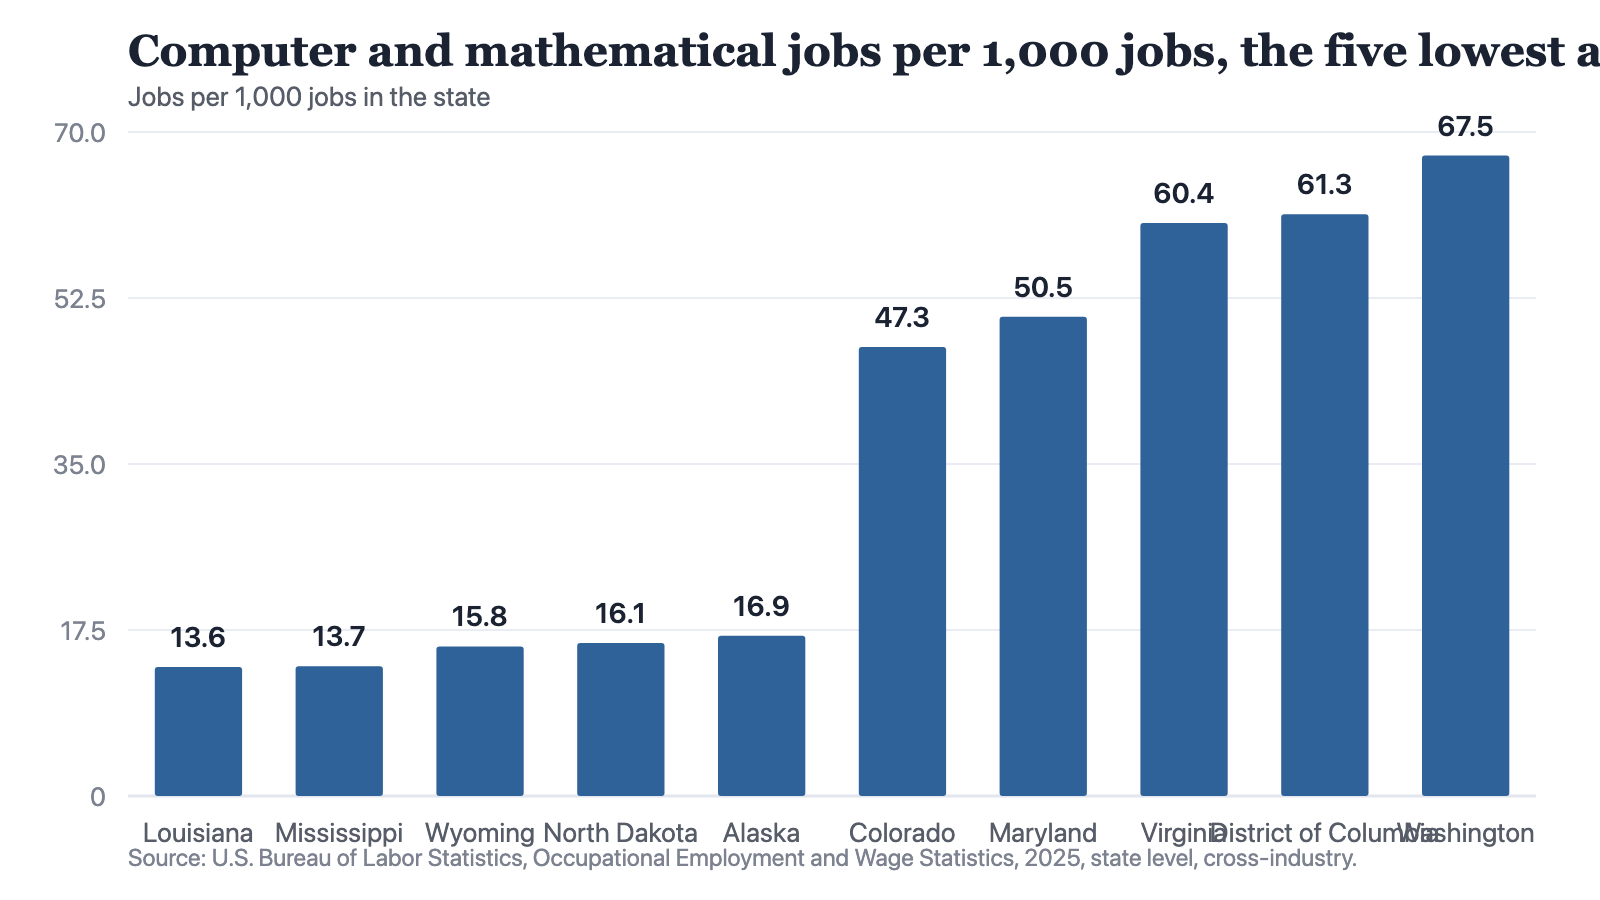
Notes: Occupational Employment and Wage Statistics, 2025, state level, cross-industry. The per-thousand figure is published by the Bureau. Only the five lowest and five highest jurisdictions are plotted, so the 41 in between do not appear.
Source: The Cefa Brief
Chart description
A bar chart of ten jurisdictions. The five lowest are Louisiana at 13.609 jobs per thousand, Mississippi at 13.687, Wyoming at 15.772, North Dakota at 16.116 and Alaska at 16.896. The five highest are Colorado at 47.327, Maryland at 50.529, Virginia at 60.396, the District of Columbia at 61.338 and Washington at 67.509. Every bar in the right-hand group is more than twice the height of every bar in the left-hand group, and the highest is 4.96 times the lowest.
A bar chart of ten jurisdictions. The five lowest are Louisiana at 13.609 jobs per thousand, Mississippi at 13.687, Wyoming at 15.772, North Dakota at 16.116 and Alaska at 16.896. The five highest are Colorado at 47.327, Maryland at 50.529, Virginia at 60.396, the District of Columbia at 61.338 and Washington at 67.509. Every bar in the right-hand group is more than twice the height of every bar in the left-hand group, and the highest is 4.96 times the lowest.
What the file does not say
Nothing in this file is a credential. It holds occupations, employment counts, median wages and concentration, and it holds nothing about qualifications, licences, certificates or degrees. No sentence here should be read as a measurement of what any education system produced. What the file does establish is narrower and harder to argue with: the structure of demand differs sharply between states, and in the very occupations the national credential debate is conducted about it differs by a factor of nearly five.
There is a reasonable reply, and it deserves stating at its strongest. A degree is not meant to be local. Its value is supposed to be that it travels, and a qualification calibrated to one state would be worth less to a worker who leaves it. I accept the point, which is the best case for a national credential and is made too rarely. But it is a claim about a worker's option value rather than about matching. A credential can travel perfectly well and still deliver its holder into the thin end of a distribution running from 67.509 jobs per thousand to 13.609, and a wage distribution running from 138,670 dollars to 75,000.
The burden on the employer-led answer
An employer-led alternative is now pressed in place of all this. Employers define the competencies, employers issue or endorse the certificate, and hiring is done against demonstrated skill rather than a degree. On the matching question the logic is sound, and I would rather argue with it than with the volume framing. An employer knows which jobs exist at that employer, which is more than any education ministry knows about anywhere.
A credential issued by the employer who will use it proves nothing to the employer who will not.
That advantage is also the whole of the difficulty, and it sets three tests. A credential issued by the employer who will use it proves nothing to the employer who will not, so the first is that the certificate be read, and priced, by a firm which did not issue it. The second is that it survive a state line, because concentration and pay both change at one, and a certificate written against Washington's 67.509 is carried into Louisiana's 13.609 by anyone who moves.
The third test is the one its advocates never address. An employer credential would have to be countable. The degree system is criticised with numbers because the numbers exist: twenty-two occupational groups for every state, twelve speciality rows each, a median wage and a concentration attached to all of them, published annually and free to anyone. Nothing of the kind is published for employer certificates. An instrument nobody can audit will always look better than one everybody can, and that is a fact about publication rather than about the instruments.
My position is that credential systems are not matching workers to the jobs that exist, and that the failure is one of unit rather than of volume. A national instrument is scored against fifty-one structures whose distinctive parts, on the Bureau's own measure, barely overlap: 351 occupations across 612 rows, 204 of them singular to one state. An employer-led alternative addresses that unit error directly, which is the strongest thing to be said for it. It has met none of the three tests, and until it publishes something a stranger can count, the honest comparison is between a system with poor numbers and a system with none.
About the author

Each author told us that for this piece they hold no interest a reader would think relevant.
This commentary carries its author's name because the view in it is the author's own. An editor reviewed it before publication, which is not the same as agreeing with it. It is not a position of the Center for Economics & Foreign Affairs or of Applied America.
© 2026. The author or authors hold the copyright in this commentary; CEFA publishes it with their permission. This edition, its editing and its presentation are © 2026 Center for Economics & Foreign Affairs. To republish it, see our republication terms. Republishing
Share
The Cefa Brief · applied.thecefa.org/cefa-brief/the-certificate-has-to-travel · Printed from the web edition