
In fifty of fifty-one jurisdictions the largest occupational group pays below the median
The biggest block of jobs in almost every American state is a below-median one, and in 47 of 51 it is the same group. Industrial work sits in the middle of that ladder, which is a better case for it than its advocates usually make and a smaller one than they claim.
by
Vantage point
I write as an editor who reads job announcements against the occupational file they never cite, and who has come to think the interesting question is not how many jobs but which rung.
Published 7 minute read

Иллюстрация: The Cefa Brief
Every industrial announcement is a job count, and every job count invites the same question, which almost nobody asks out loud. Where on the existing ladder do these jobs land? The 2025 occupational file answers it, and the answer is not the one either side of the argument would choose. In 50 of the 51 jurisdictions the single largest occupational group is paid below that state's own median wage. In 47 of them that group is the same one: Office and Administrative Support Occupations. The job base of the United States is bottom-heavy in a very specific and repeatable way, and a programme that adds work in the middle of the ladder does not change its shape.
I want to make that claim carefully, because there is an obvious objection to it that I will come to and concede a great deal of. First the structure, which is the part that is not obvious at all.
One state's ladder, in full
Take Ohio, a state of 5,550,180 jobs with a median wage of 49,380 dollars. The Bureau divides that workforce into 22 occupational groups which sum exactly to the total, so nothing is hidden in a residual. The five largest groups are Office and Administrative Support at 610,590 jobs, Transportation and Material Moving at 529,060, Food Preparation and Serving Related at 494,660, Sales and Related at 459,090 and Production at 451,510. Together they are 2,544,910 jobs, 45.9 percent of every job in the state. All five are paid below the state median. The sixth largest group, Healthcare Practitioners and Technical, is the first one that is not, at 80,820 dollars.
The distances inside that list matter more than the fact of being below. Office and Administrative Support is 2,730 dollars under the state median, which is close to the middle. Production is 2,200 under. But Sales and Related sits at 36,450 and Food Preparation and Serving Related at 30,300, which is 19,080 dollars under the median and less than a third of what Ohio's Management Occupations are paid, at 105,770. That ratio, the top group against the bottom group, is 3.49 in Ohio. It is the shape of the thing, and it is visible in a single state without any modelling at all.
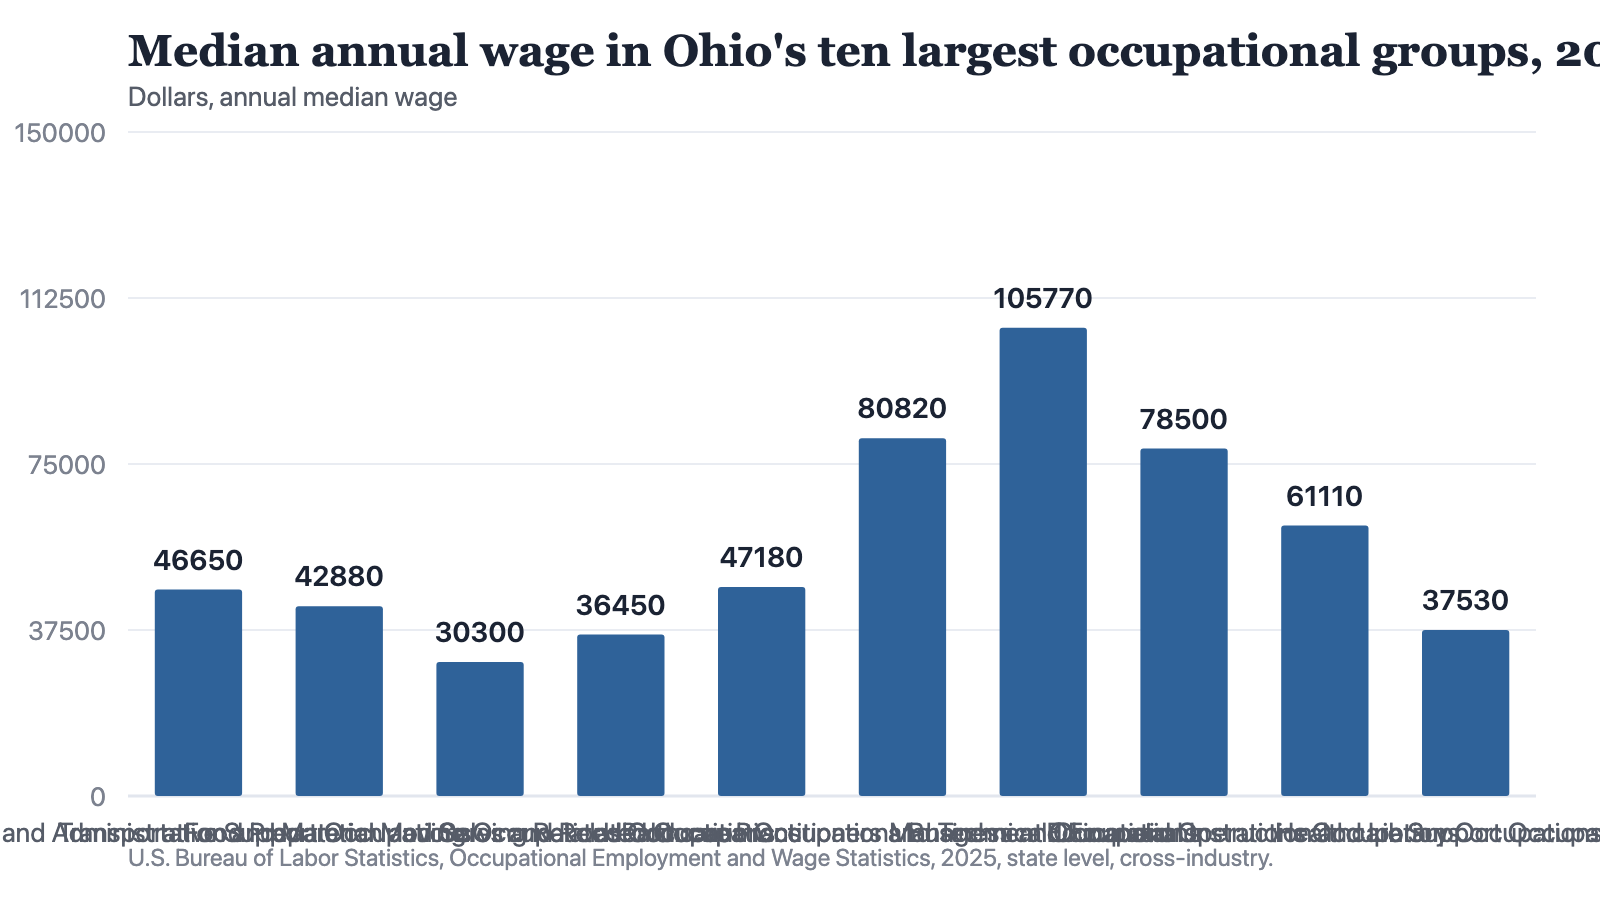
Notes: Ohio's overall median wage across all occupations is 49,380 dollars. The 22 major groups sum exactly to the state's 5,550,180 jobs. Group titles are the Bureau's own.
Source: The Cefa Brief
Chart description
Ordered by employment, largest first: Office and Administrative Support Occupations, 610,590 jobs at a median of 46,650 dollars; Transportation and Material Moving, 529,060 jobs at 42,880; Food Preparation and Serving Related, 494,660 at 30,300; Sales and Related, 459,090 at 36,450; Production, 451,510 at 47,180; Healthcare Practitioners and Technical, 409,590 at 80,820; Management, 405,060 at 105,770; Business and Financial Operations, 350,540 at 78,500; Educational Instruction and Library, 322,700 at 61,110; and Healthcare Support, 244,030 at 37,530. The five largest groups all pay below Ohio's median wage of 49,380. The three best-paid groups in this list are the sixth, seventh and eighth largest.
Ordered by employment, largest first: Office and Administrative Support Occupations, 610,590 jobs at a median of 46,650 dollars; Transportation and Material Moving, 529,060 jobs at 42,880; Food Preparation and Serving Related, 494,660 at 30,300; Sales and Related, 459,090 at 36,450; Production, 451,510 at 47,180; Healthcare Practitioners and Technical, 409,590 at 80,820; Management, 405,060 at 105,770; Business and Financial Operations, 350,540 at 78,500; Educational Instruction and Library, 322,700 at 61,110; and Healthcare Support, 244,030 at 37,530. The five largest groups all pay below Ohio's median wage of 49,380. The three best-paid groups in this list are the sixth, seventh and eighth largest.
Now place the industrial occupations on that ladder, because this is the part that cuts against the easy critique of industrial policy as well as against its easy defence. Ohio's Production Occupations pay 47,180 dollars, its Installation, Maintenance and Repair Occupations 59,810, and its Construction and Extraction Occupations 62,140. Those are not top-of-ladder wages and they are nothing like bottom-of-ladder wages. They sit in the middle, and two of the three are comfortably above the state median. Anyone who says a factory job is a bad job is not reading this file. Anyone who says it transforms a regional income distribution is not reading it either.
The objection that is half right
Here is the objection, and it is a good one. Roughly half of all workers earn below the median, because that is what a median is. Saying that about half of a state's jobs sit in groups paying below the state median is close to saying nothing at all. It is arithmetic dressed as a finding, and any reader who has been shown a chart like this should be suspicious of it.
I concede that entirely for the share. Across the 51 jurisdictions, the proportion of jobs sitting in groups whose median is below the state median runs from 43.8 percent in the District of Columbia to 62.5 percent in Nevada, with a middle value of 53.6 percent, and I would not publish those numbers as a discovery. They are close to what the definition forces, and a reader is right to shrug at them.
What the definition does not force is which group is the largest, and that is the finding. Nothing in the arithmetic of a median requires the biggest occupational group in a state to be a below-median one. It could be healthcare practitioners, or management, or education. In 50 of 51 jurisdictions it is not. In 47 of them it is the same below-median group, Office and Administrative Support Occupations. The single exception in the country is the District of Columbia, where the largest group is Business and Financial Operations Occupations, 110,570 jobs at a median of 109,990 against a District median of 91,540, which tells you what kind of place the District is rather than undermining the pattern. That consistency is a fact about how American labour demand is composed, and no definition produces it.
Some ladders are steeper than others
The same file supports one more comparison that is not forced by arithmetic. Divide each state's best-paid occupational group by its worst-paid, and you get the internal reach of that labour market. It runs from 2.81 in Vermont, where Management pays 107,520 and Food Preparation and Serving Related pays 38,210, to 4.95 in the District of Columbia, where Legal Occupations pay 195,190 and Building and Grounds Cleaning and Maintenance pay 39,430. The middle of the 51 is 3.69. New Jersey is 4.57, New York 4.37, Louisiana 4.37, Massachusetts 4.27, Georgia 4.27. Maine is 2.87, Hawaii 2.94, Arizona 3.06, Arkansas 3.07.
Two things about that list are worth pausing on. The first is that it does not sort by wealth. Louisiana, with a state median wage of 45,520 dollars, has a steeper occupational ladder than Massachusetts at 63,590. Steepness is a fact about the composition of demand, not about prosperity. The second is that in 49 of 51 jurisdictions the group at the top is Management Occupations, and in 40 of 51 the group at the bottom is Food Preparation and Serving Related. The identity of the rungs is nearly constant across the country. Only the distance between them moves.
I should be plain that this is a comparison of occupational groups and not of people. It says nothing about how many individuals earn what, nothing about hours, nothing about households, and nothing about mobility between groups over a working life. It is a statement about the structure of a state's demand for labour at one moment, which is a narrower and more defensible thing than an inequality measure and should not be quoted as one.
What this means for the jobs number
The honest conclusion cuts both ways, which is why I think it is worth publishing. Industrial work is mid-ladder work. In Ohio it pays between 47,180 and 62,140 dollars depending on the group, against a food service median of 30,300 and a management median of 105,770. For a worker moving out of the largest low-paid groups, that is a real improvement and the case for industrial policy as a labour market intervention is strongest right there. It is a weaker case than its advocates make and a much stronger one than its critics allow.
The limit is one of scale rather than quality. Ohio's five largest occupational groups hold 2,544,910 jobs. An industrial programme that created ten thousand production jobs in Ohio would move four tenths of one percent of that mass. The structure that puts nearly half a state's workforce in below-median groups is not created by the absence of factories and is not dissolved by their arrival. It is the composition of what an advanced service economy demands, and it is the same composition in Ohio, Georgia and North Carolina, where the four largest occupational groups are the same four groups in a different order.
- This is one year. The file holds 2025 and no history, so nothing here shows whether any ladder is steepening or flattening.
- These are medians by occupational group, not by person or household. A group median conceals the distribution inside the group entirely.
- There is no industry detail and no sub-state geography. The same group median covers a metropolitan labour market and a rural county.
- Nothing here is adjusted for cost of living, hours, benefits or taxes, none of which are in the source.
- Seven wage estimates across the whole file were not released by the Bureau and are absent rather than zero. No wage in the file is at the Bureau's reporting cap of 239,200 dollars.
What I would like to see alongside the next job count is the one line that would make it interpretable: which occupational group the jobs fall into, and what that group's median already pays in that state. Both numbers are public, free and older than the announcement, which means the only reason to omit them is that they complicate the sentence. They do complicate it. They also make it true.
The structure that puts nearly half a state's workforce in below-median groups is not created by the absence of factories and is not dissolved by their arrival.
There is a version of this argument that ends in resignation, and I do not mean it that way. A policy can be worth doing without being transformative, and most good policy is. What the occupational data asks of anyone making the case is modesty about the mechanism and precision about the beneficiary. Say which rung the jobs land on. Say how many there are against the size of the rungs below. Then the argument can be had on what is actually true, which is the only ground on which it can be won.
How to cite
Jag DeSaint, "In fifty of fifty-one jurisdictions the largest occupational group pays below the median," The Cefa Brief, Applied America, 12 августа 2026 г., https://applied.thecefa.org/cefa-brief/where-the-new-jobs-land-on-the-ladder.
About the author

Each author told us that for this piece they hold no interest a reader would think relevant.
This Perspectives piece carries its author's name because the view in it is the author's own. An editor reviewed it before publication, which is not the same as agreeing with it. It is not a position of the Center for Economics & Foreign Affairs or of Applied America.
© 2026. The author or authors hold the copyright in this Perspectives piece; CEFA publishes it with their permission. This edition, its editing and its presentation are © 2026 Center for Economics & Foreign Affairs. To republish it, see our republication terms. Republishing
Share
The Cefa Brief · applied.thecefa.org/cefa-brief/where-the-new-jobs-land-on-the-ladder · Printed from the web edition