
Six productivity readings cannot carry the case being made for artificial intelligence
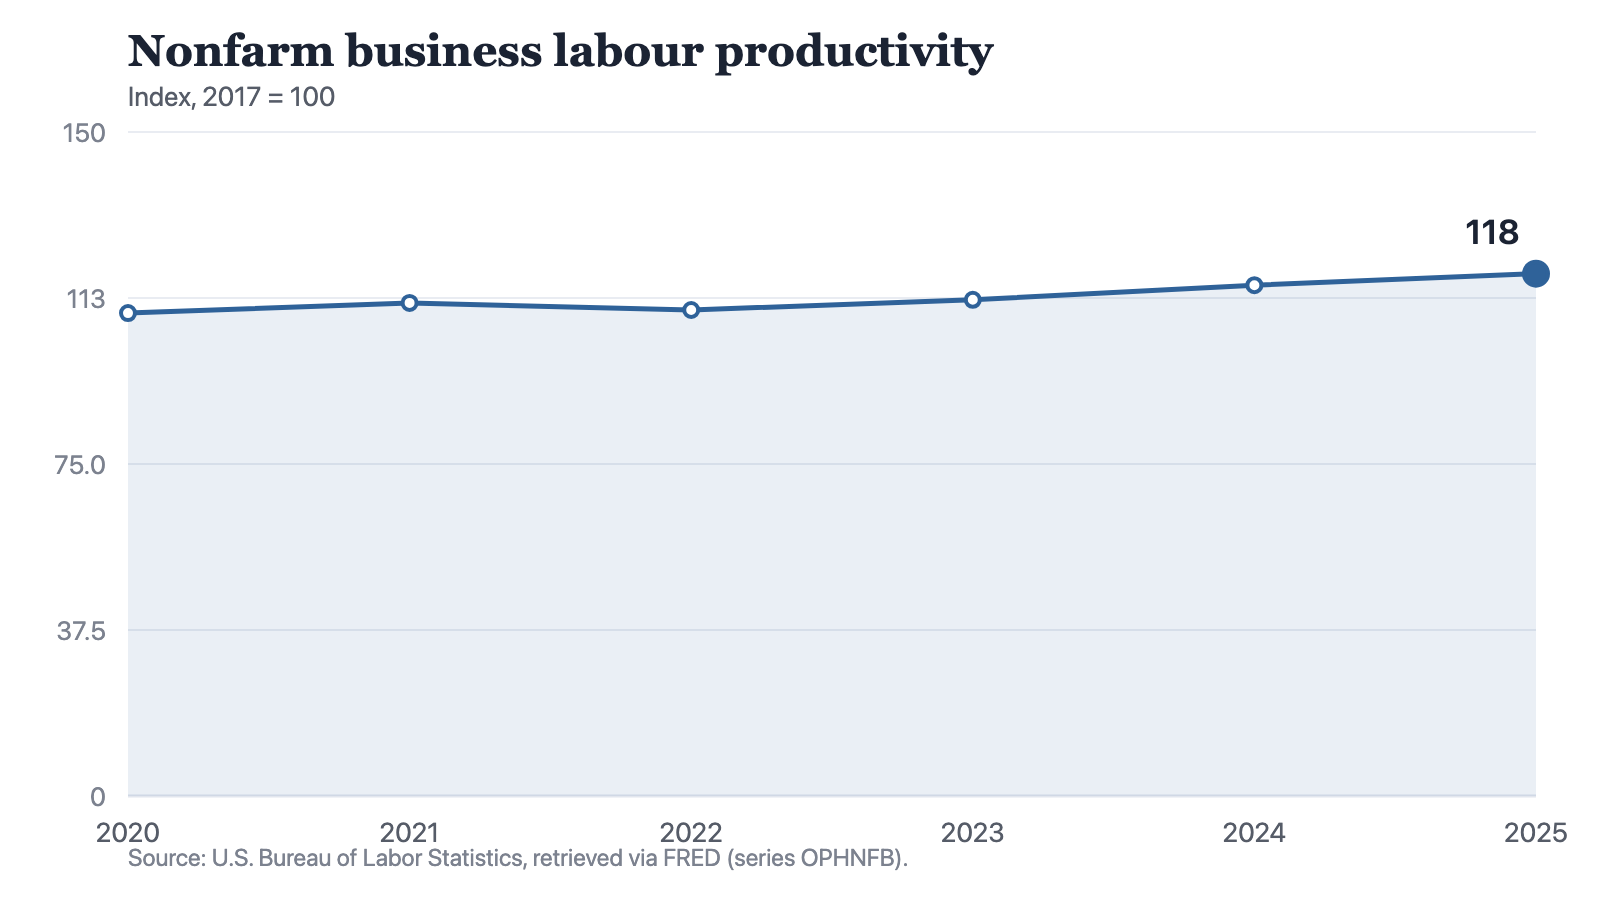
Output per hour in the nonfarm business sector went from 109.1 in 2020 to 118 in 2025 on a 2017 base of 100, and the largest single step in that window, 3.3 points, landed in 2024 rather than 2025. The two fastest years for the ratio are also the two slowest years for payrolls, which is the shape a shrinking denominator makes as well as the shape a new technology makes.
by
Published 5 minute read

Abbildung: The Cefa Brief
The case for artificial intelligence has reached the stage where it is argued in statistics. Firms describe gains in output. Investors describe a change in the production function. Officials describe a coming rise in national productivity. All three claims land on the same published number, output per hour in the nonfarm business sector, because a general-purpose technology that is general and is working would have to appear there.
My position is that the number does not yet show it. That is not a claim that the technology does nothing and it is not a forecast about what the series will do next. It is a statement about what six annual observations can carry, which is less than the people citing them require. The same six points are consistent with a large effect, a small one and none at all. What follows sets out why, and then what would have to change before the series could tell those cases apart.
The line the claim would have to appear in
Output per hour in the nonfarm business sector, indexed so that 2017 equals 100, reads 109.1 in 2020, 111.4 in 2021, 109.8 in 2022, 112.1 in 2023, 115.4 in 2024 and 118 in 2025. The latest reading stands 18 points above the base. Across the whole window the index added 8.9 points.
Put the advocates' case in its strongest form first, because it has one. Of those 8.9 points, 8.2 arrived in the last three observations. The index fell 1.6 points into 2022 and has climbed in every year since. Anyone arguing that something changed around 2023 has a real pattern to point at, and the pattern is not small.
Notes: Annual observations. The index is a level, not a rate of change, and it covers the nonfarm business sector as a whole rather than any industry, firm or technology within it.
Source: The Cefa Brief
Chart description
A line chart of output per hour on an index where 2017 equals 100, showing 109.1 in 2020, 111.4 in 2021, 109.8 in 2022, 112.1 in 2023, 115.4 in 2024 and 118 in 2025. The line rises into 2021, falls into 2022, and then rises in each of the three following years. The steepest step is between 2023 and 2024 and the final step, between 2024 and 2025, is shallower than the one before it.
A line chart of output per hour on an index where 2017 equals 100, showing 109.1 in 2020, 111.4 in 2021, 109.8 in 2022, 112.1 in 2023, 115.4 in 2024 and 118 in 2025. The line rises into 2021, falls into 2022, and then rises in each of the three following years. The steepest step is between 2023 and 2024 and the final step, between 2024 and 2025, is shallower than the one before it.
Two features of the same series work against that reading. The step into 2023 is 2.3 points, which is exactly the step the index took into 2021, before any of the deployment now being described. And the step into 2025 is 2.6 points against 3.3 the year before, a deceleration of 0.7 points. A technology spreading through an economy produces acceleration while it spreads. This series slowed in its most recent year.
A single slower observation refutes nothing either, and that is the difficulty. The window holds a best step of 3.3 points and a worst of minus 1.6, a spread of 4.9 points. Every movement of the last three years sits inside that spread. A series whose ordinary year-to-year variation is that wide cannot separate a transformation from a good run until the run outlasts the variation.
The denominator
Output per hour is a ratio and the hours sit underneath it. Total nonfarm payroll employment, a separate count from a separate series, reads 142.2 million in 2020, 146.3 in 2021, 152.5 in 2022, 155.9 in 2023, 157.7 in 2024 and 158.4 in 2025. Year on year that is 4.1 million jobs added, then 6.2, then 3.4, then 1.8, then 0.7.
The two years in which measured productivity rose fastest, 2024 and 2025, are the two years in which payrolls grew slowest. I have not divided one series by the other and nothing here should be read as though I had. Payrolls count filled jobs and the productivity denominator counts hours, and those are not the same quantity. What the juxtaposition establishes is a question that has to be answered before the climb can be attributed to anything at all.
A ratio can be pushed up from below. Until the numerator and the denominator are read apart, an adoption story and a hiring freeze leave the same mark on the line.
What the statistics do measure about computers
One series in this brief's data names computers, and it measures the wrong side of the transaction. Computer and electronic product output, on a 2017 base of 100, reads 105.7 in 2020 and 126.8 in 2025: 26.8 points above its base, and 21.1 points added across the window. That is a measure of building the equipment. Manufacturing output as a whole, published by the same agency on the same base, reads 93 in 2020 and 97.3 in 2025, still 2.7 points below its own 2017 level after adding 4.3 points across the window.
Those two indexes cover different populations, one of them inside the other, and I have not divided them. Set side by side they say something plain. The sector that makes the hardware is well above where it was. The sector that is meant to be changed by using the hardware is not. A supplier boom is evidence that equipment is being bought; it is not evidence that the equipment has changed what the buyers produce in an hour.
Spending shows the same asymmetry. Research and development inside gross domestic product, stated at a seasonally adjusted annual rate, went from 754 billion dollars in 2020 to 1,081 billion in 2025, an increase of 327 billion at that yearly rate. Money registers in the national accounts as soon as it is spent. A return on it need not register at the same speed, or at all. That series covers all research and development and identifies no technology, which is the condition of every series here: nothing in the data behind this brief is named for the thing being argued about.
What would count as evidence
Three things would move me, and none of them is available yet. The first is duration. A claim about a general-purpose technology needs steps that sit outside the series' own ordinary variation, and it needs them consecutively. The variation here is 4.9 points wide. Three years, one of which repeats a step the index took in 2021 and one of which is slower than the year before it, do not clear it.
Separation by industry is the second. A technology that works unevenly, as this one is said to, should appear as output per hour measured industry by industry, with the exposed industries pulling away from the unexposed ones on a common base and in a common release. That comparison is not made in this piece, because this brief holds an aggregate productivity series and no industry one. Naming that limit is better than doing what most of the published argument does, which is to substitute an output index for a productivity measure and hope the reader does not check which is which.
The third concerns the direction of the ratio. Evidence for an adoption story is output rising while hours hold. Output holding while hours fall is a cost reduction, and it moves the index in the same direction by the same amount. Telling the two apart means reading the numerator and the denominator against each other instead of quoting the quotient. A single index number cannot do it, and a single index number is what is being quoted.
None of this is a verdict on the technology. It is a verdict on the evidence offered for it, which is an aggregate index with six annual points, no industry split, no separation of output from hours, and no line anywhere in it that names the subject. This Commentary was itself drafted with the help of such a system, which is a fact about one document and not a measurement of anything. The statistics will answer the question eventually. They have not answered it yet, and almost the whole of the current argument is being conducted in the gap between those two sentences.
About the author

Each author told us that for this piece they hold no interest a reader would think relevant.
This commentary carries its author's name because the view in it is the author's own. An editor reviewed it before publication, which is not the same as agreeing with it. It is not a position of the Center for Economics & Foreign Affairs or of Applied America.
© 2026. The author or authors hold the copyright in this commentary; CEFA publishes it with their permission. This edition, its editing and its presentation are © 2026 Center for Economics & Foreign Affairs. To republish it, see our republication terms. Republishing
Share
The Cefa Brief · applied.thecefa.org/cefa-brief/no-series-is-called-artificial-intelligence · Printed from the web edition