
Four fifths of the rise in new business applications since 2020 came in a single year
The weekly average went from 84 thousand applications in 2020 to 104 thousand in 2021, and the four years since have added five. The 2025 reading of 109 thousand is the highest of the six, and also the third rise in a series that has fallen in the year between each one.
by
Published 2 minute read

Abbildung: The Cefa Brief
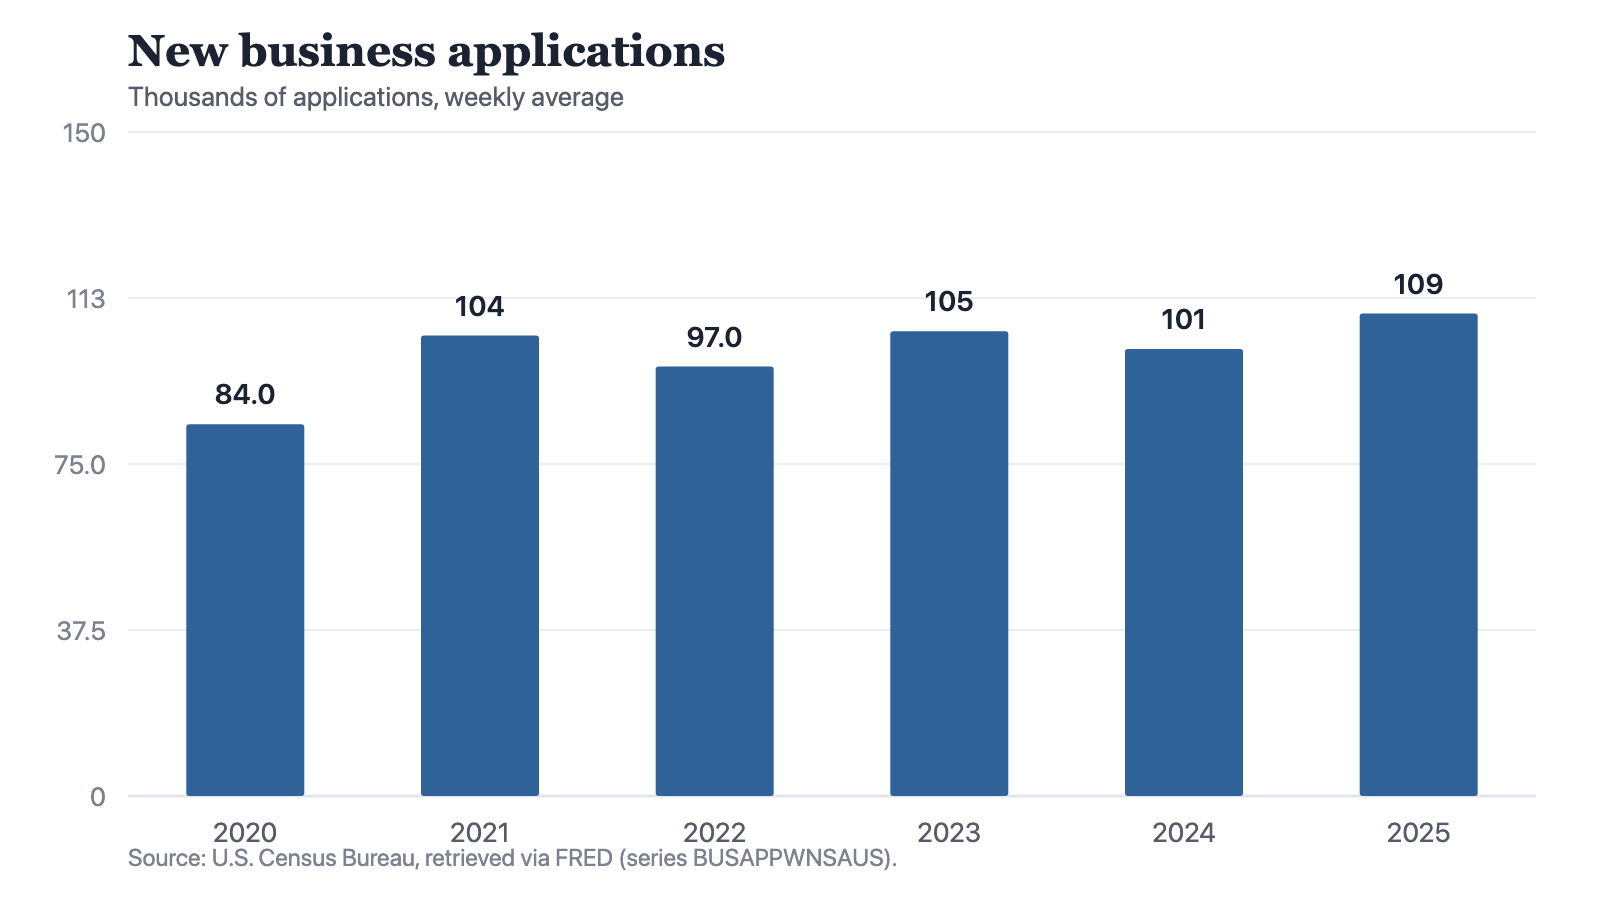
New business applications run 25 thousand a week higher in 2025 than in 2020. Twenty of that 25 arrived in one year. The weekly average went from 84 thousand applications in 2020 to 104 thousand in 2021, and the four years since then have added five.
The six readings are 84 thousand in 2020, 104 in 2021, 97 in 2022, 105 in 2023, 101 in 2024 and 109 in 2025. Each is the average number of applications filed in a week of that year.
Notes: Annual observations. Each point is the average of the periods within the year, not the year’s total.
Source: The Cefa Brief
Chart description
A bar chart of new business applications, in thousands of applications filed in an average week: 84 thousand in 2020, 104 in 2021, 97 in 2022, 105 in 2023, 101 in 2024 and 109 in 2025. The bar for 2021 stands well above the one before it, and the five bars from 2021 onward alternate down and up within a narrow range, with 2025 the tallest of the six.
A bar chart of new business applications, in thousands of applications filed in an average week: 84 thousand in 2020, 104 in 2021, 97 in 2022, 105 in 2023, 101 in 2024 and 109 in 2025. The bar for 2021 stands well above the one before it, and the five bars from 2021 onward alternate down and up within a narrow range, with 2025 the tallest of the six.
Five steps, one of them large
Year on year the series added 20 thousand, gave back 7, added 8, gave back 4, then added 8. The first step is two and a half times the largest of the four that followed it. Since 2021 the series has not moved in the same direction twice in a row, and every reading has sat inside a band running from 97 thousand to 109.
The floor has risen along with the ceiling. The low after 2021 was 97 thousand in 2022; the low after 2023 was 101 thousand in 2024. Each fall has been shallower than the rise before it. That is the strongest thing the shape supports, and it is weaker than it sounds: 2024, at 101 thousand, still came in 3 thousand below 2021.
What an application is
Two things about the measure. Each point is a weekly average rather than a year's total, so 109 thousand is the count for an average week of 2025 and reading it as the year's count would be wrong by roughly a factor of fifty-two. And an application is a filing. The series counts the form, not the firm. It does not say how many of these applications became a business that traded, hired anyone or lasted a year, and that gap is the whole distance between an intention and a company.
One 2021 move held, another did not
The rate at which people quit a job moved in 2021 as well, from 2.1 per cent of employment in 2020 to 2.7, and on to 2.8 in 2022. It has fallen in every year since: 2.4 in 2023, 2.1 in 2024 and 2 in 2025, which is below where it started. Business applications did not do that. The lowest reading since 2021 is 97 thousand, 13 above the 2020 figure, and the series has not gone back toward its starting point. These are two series from two agencies and nothing here connects them. What they show, held side by side, is that one shift in 2021 was given back in full and one was not.
The 2025 reading is the highest of the six and the largest rise since 2021, tied with 2023 at 8 thousand. It is not yet evidence of a break. Every rise in this series since 2021 has been followed by a fall, so 109 thousand is equally consistent with a new direction and with the top of the same band. What would settle it is a second year in the same direction, which the window does not contain: a 2026 reading above 109 thousand would break the pattern, and one near 101 would confirm it. Until then the defensible sentence is the plain one. The level stepped up once, in 2021, and has moved inside a band 12 thousand wide ever since.
Method and data
The figures are annual observations of new business applications, series BUSAPPWNSAUS, published by the U.S. Census Bureau, redistributed by FRED and retrieved for this site on 19 September 2026. They are stated in thousands of applications at a weekly average, so each annual point is the average number of applications filed in a week of that year and not the year's total; reading 109 thousand as the count of applications filed in 2025 would be wrong by roughly a factor of fifty-two. The series counts applications filed. It does not count businesses formed, and it says nothing about how many of those applications became a firm that traded, hired anyone or lasted a year. The quits rate quoted later is a separate series from a separate agency, named for contrast only. Nothing here divides one series by the other or claims a link between them.
How to cite
Jag DeSaint, "Four fifths of the rise in new business applications since 2020 came in a single year," The Cefa Brief, Applied America, 11. März 2026, https://applied.thecefa.org/cefa-brief/four-more-years-added-five.
About the author

Each author told us that for this piece they hold no interest a reader would think relevant.
This Insights piece carries its author's name because the view in it is the author's own. An editor reviewed it before publication, which is not the same as agreeing with it. It is not a position of the Center for Economics & Foreign Affairs or of Applied America.
© 2026. The author or authors hold the copyright in this Insights piece; CEFA publishes it with their permission. This edition, its editing and its presentation are © 2026 Center for Economics & Foreign Affairs. To republish it, see our republication terms. Republishing
Share
The Cefa Brief · applied.thecefa.org/cefa-brief/four-more-years-added-five · Printed from the web edition