
The deficit widened most in the year the debt ratio was lowest
Into 2023 the deficit widened by 313 billion dollars, the largest single-year widening in the window, and federal debt that year stood at 117.7 per cent of GDP, the lowest of its own six readings. Across the five year-on-year moves the two series ran in the same direction three times and in opposite directions twice.
by
Published 3 minute read

Abbildung: The Cefa Brief
The federal deficit widened by 313 billion dollars into 2023, the largest single-year deterioration in the window. Federal debt in that same year stood at 117.7 per cent of GDP, the lowest of its own six readings. The deficit's worst step and the debt ratio's best reading sit against the same year label. The two series are not aligned to a common period.
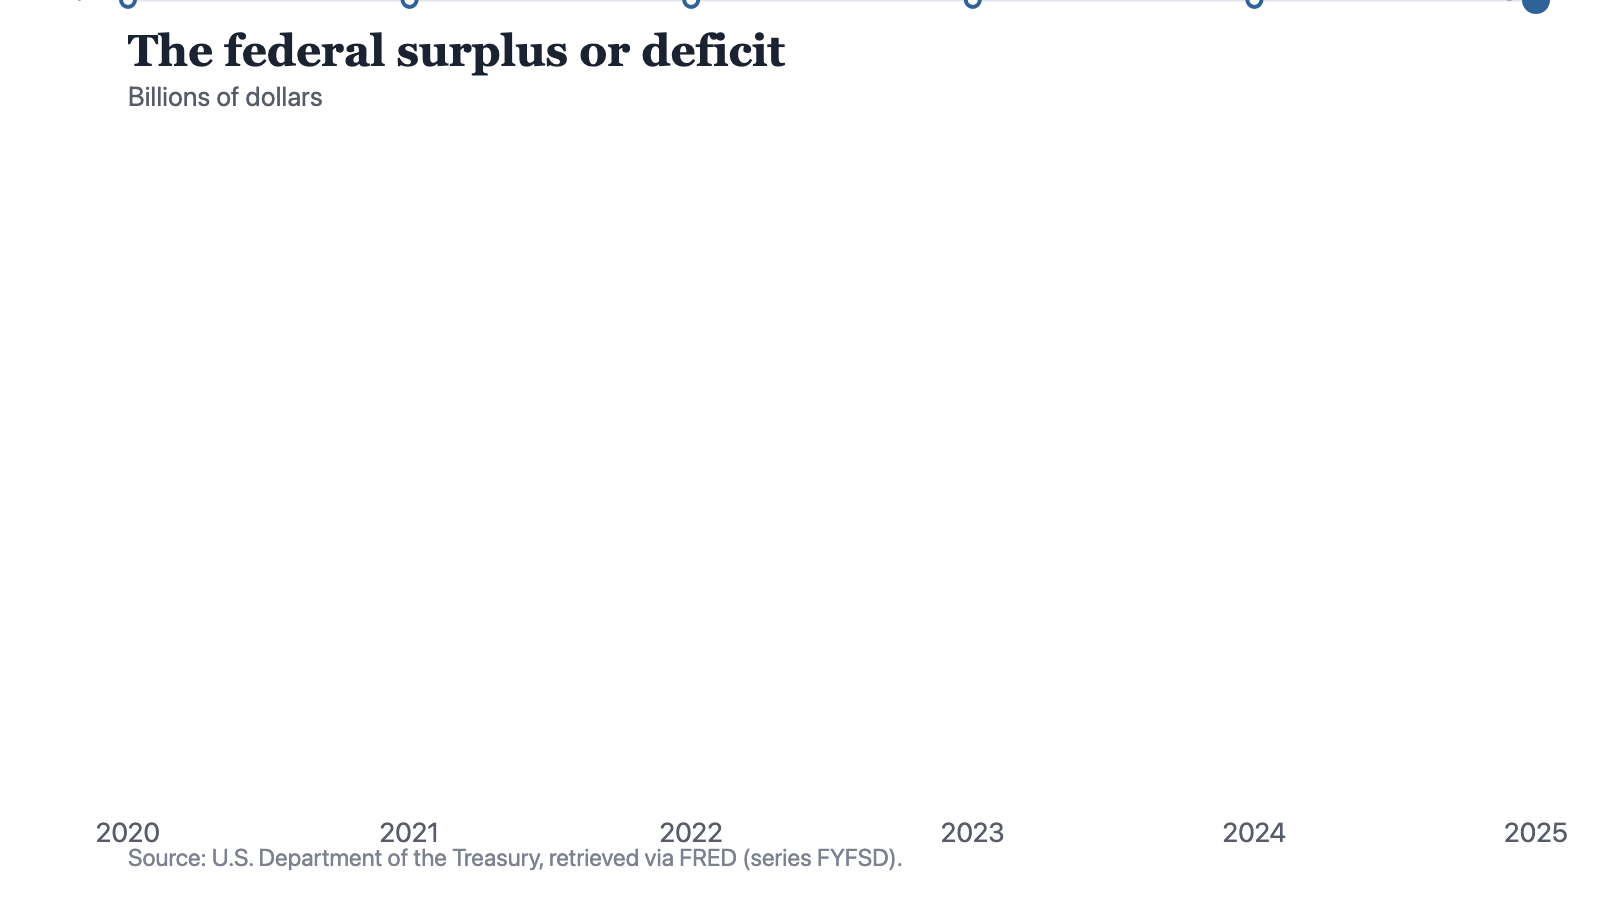
Six readings run 3,096 billion dollars in 2020, 2,774 in 2021, 1,374 in 2022, 1,687 in 2023, 1,815 in 2024 and 1,775 in 2025. The series is published as a surplus or deficit and every one of these values is negative, so all six are deficits. The six together come to 12,521 billion dollars.
Notes: Values are in dollars of their own year, with no adjustment for prices. The series states the gap between receipts and outlays and carries no information about the stock of debt.
Source: The Cefa Brief
Chart description
A line chart of the federal surplus or deficit: minus 3,096 billion dollars in 2020, minus 2,774 in 2021, minus 1,374 in 2022, minus 1,687 in 2023, minus 1,815 in 2024 and minus 1,775 in 2025. Because every value is negative, the line sits below zero throughout and a higher point means a smaller deficit. It climbs steeply from 2020 to 2022, with by far the largest step between 2021 and 2022, then falls in 2023 and again in 2024 before rising slightly in 2025.
A line chart of the federal surplus or deficit: minus 3,096 billion dollars in 2020, minus 2,774 in 2021, minus 1,374 in 2022, minus 1,687 in 2023, minus 1,815 in 2024 and minus 1,775 in 2025. Because every value is negative, the line sits below zero throughout and a higher point means a smaller deficit. It climbs steeply from 2020 to 2022, with by far the largest step between 2021 and 2022, then falls in 2023 and again in 2024 before rising slightly in 2025.
Two years of repair, two of reversal
Year on year the deficit shrank by 322 billion dollars, then by 1,400, then grew by 313, then by 128, then shrank by 40. The repair is concentrated almost entirely in one step: the move into 2022 is more than four times the move into 2021. Across those first two years the deficit fell by 1,722 billion, from 3,096 to 1,374, and the 2020 reading is more than double the 2022 one, since 1,374 doubled is 2,748.
Since that 2022 low the deficit has grown by 401 billion, from 1,374 to 1,775. That is just under a quarter of the 1,722 given back, since a quarter of 1,722 is 430.5. The last four readings sit in a band 441 billion wide, between 1,374 and 1,815, and the most recent one is 40 billion better than the year before it. Three years of movement have not taken the series out of that band.
The ratio kept falling for a year
Federal debt as a share of GDP reads 122.3 per cent in 2020, 120.9 in 2021, 118.4 in 2022, 117.7 in 2023, 120.4 in 2024 and 120.7 in 2025. Its year-on-year moves are a fall of 1.4 points, a fall of 2.5, a fall of 0.7, a rise of 2.7 and a rise of 0.3. The whole range of the six readings is 4.6 points, and 2025 sits 1.6 points below 2020.
Set those five moves against the five in the deficit and three of them agree. In 2023 they do not: the deficit widened by its largest step and the ratio fell to its low. In 2025 they do not either, in the other direction: the deficit narrowed by 40 billion and the ratio rose by 0.3 points. Two disagreements in five moves is not noise around a rule.
A deficit is what one year adds. A debt ratio is everything already owed, measured against an economy that is itself changing size. They are not obliged to move together.
These are two series from two separate arrangements and nothing above divides one by the other. They are not aligned to a common period, and this piece does not compute the deficit as a share of anything. What it does is place the two windows side by side and note where their turning points sit, which is one year apart at the bottom.
What the series will and will not tell you
Two properties of the measure shape how it can be read. The values are in dollars of their own year, so a deficit of 1,775 billion in 2025 and one of 1,687 in 2023 are not the same quantity of purchasing power, and this series will not tell you the difference. The sign convention matters too: on the chart a rising line means a shrinking deficit, which is the opposite of the reading a glance usually gives.
A third limit is larger than either. The series is a single difference between two very large totals. It does not say which receipts rose, which outlays rose, or whether either changed at all, because the same 1,775 billion can be arrived at many ways. Anyone using the deficit to argue about spending is using a number that contains no spending figure.
The defensible summary is narrow. The deficit fell hard for two years, gave back 401 billion of that in the three years since, and has stayed inside a band 441 billion wide since 2022. The debt ratio reached its low a year after the deficit reached its own, and now sits 1.6 points below where the window opened. Both of those are true, and neither is evidence about the other.
Method and data
The figures are annual observations of the federal surplus or deficit, series FYFSD, published by the U.S. Department of the Treasury, redistributed by FRED and retrieved for this site on 19 September 2026. They are stated in billions of dollars, and a negative value is a deficit: every reading in this window is negative, so the series records six deficits and no surplus. The unit carries no averaging qualifier, so each point is the year's figure as the series states it rather than a monthly or quarterly average, and it is a figure in dollars of its own year with no adjustment for prices. The series records the gap between receipts and outlays and nothing more: it does not say what was spent on, what was collected from, or what the outstanding stock of debt is. Federal debt as a share of GDP, series GFDEGDQ188S, published by the Treasury and the Bureau of Economic Analysis and retrieved on the same date, is named here for contrast only. It is a separate series on a separate basis; nothing in this piece divides one by the other, the two are not aligned to a common period, and no relationship between them is tested. The window ends at 2025, so no figure here describes the position on the retrieval date.
How to cite
Jag DeSaint, "The deficit widened most in the year the debt ratio was lowest," The Cefa Brief, Applied America, 17. Dezember 2025, https://applied.thecefa.org/cefa-brief/a-flow-is-not-a-stock.
About the author

Each author told us that for this piece they hold no interest a reader would think relevant.
This Insights piece carries its author's name because the view in it is the author's own. An editor reviewed it before publication, which is not the same as agreeing with it. It is not a position of the Center for Economics & Foreign Affairs or of Applied America.
© 2025. The author or authors hold the copyright in this Insights piece; CEFA publishes it with their permission. This edition, its editing and its presentation are © 2025 Center for Economics & Foreign Affairs. To republish it, see our republication terms. Republishing
Share
The Cefa Brief · applied.thecefa.org/cefa-brief/a-flow-is-not-a-stock · Printed from the web edition