
Federal policy cannot raise housing supply and should pay for authorisations instead
Idaho authorised 0.98 new private housing units per thousand residents in July 2026 and California 0.21, a ratio of 4.66, under the same federal tax code and the same policy rate. Idaho's house-price index has still multiplied 8.78 times since 1980 against California's 9.75, so authorising more has not by itself held appreciation down.
by
Published 5 minute read

Abbildung: The Cefa Brief
Federal policy cannot raise the number of houses built in the United States. My position is that it should stop trying, and should instead price the money it already spends off the one housing number a local jurisdiction fully controls, which is new private housing units authorised per resident. The Census Bureau collects that number every month, for all fifty states and the District of Columbia. I know of no federal programme priced off it.
The case begins with a single month. In July 2026 Idaho authorised 1,959 new private housing units against a population of 2,001,619, which is 0.98 units per thousand residents. California authorised 8,285 against 39,431,263, which is 0.21. The ratio between them is 4.66. Texas, with 8,140,432 fewer residents than California, authorised 10,106 more units.
Set against those figures every federal instrument is a constant. One tax code applies in Boise and in Los Angeles. One federally chartered secondary mortgage market stands behind both. One policy rate prices the credit in both. A constant cannot explain a variable, and a uniform instrument cannot correct one. Whatever produces a factor of 4.66 between two states is being decided somewhere no federal instrument reaches.
The price signal was loud and the quantity did not move
The national series make the same point from the other side. The Case-Shiller national home-price index, on a January 2000 base of 100, reads 222.1 in 2020, 260 in 2021, 298.3 in 2022, 305.7 in 2023, 321.4 in 2024 and 328.5 in 2025. That is a rise of 106.4 points, or 47.9 per cent of the 2020 reading. Housing starts across the same six years read 1.39 million units at an annual rate, then 1.6, 1.55, 1.42, 1.37 and 1.36. Six years of the loudest price signal a market can make, and the quantity ended the window 0.03 million units below where it began.
Money was not the obstacle throughout. The thirty-year fixed mortgage rate averaged 3.11 per cent in 2020 and 2.96 in 2021, the cheapest reading in the window, and 2021 is the year starts reached their peak of 1.6 million. That peak is the ceiling. It is what the cheapest mortgage credit of the window coincided with, and the 2025 figure of 1.36 million sits 15 per cent below it. The rate then ran 5.34 per cent in 2022, 6.81 in 2023, 6.72 in 2024 and 6.6 in 2025. I have divided nothing by anything here, and none of it establishes that either series moved the other.
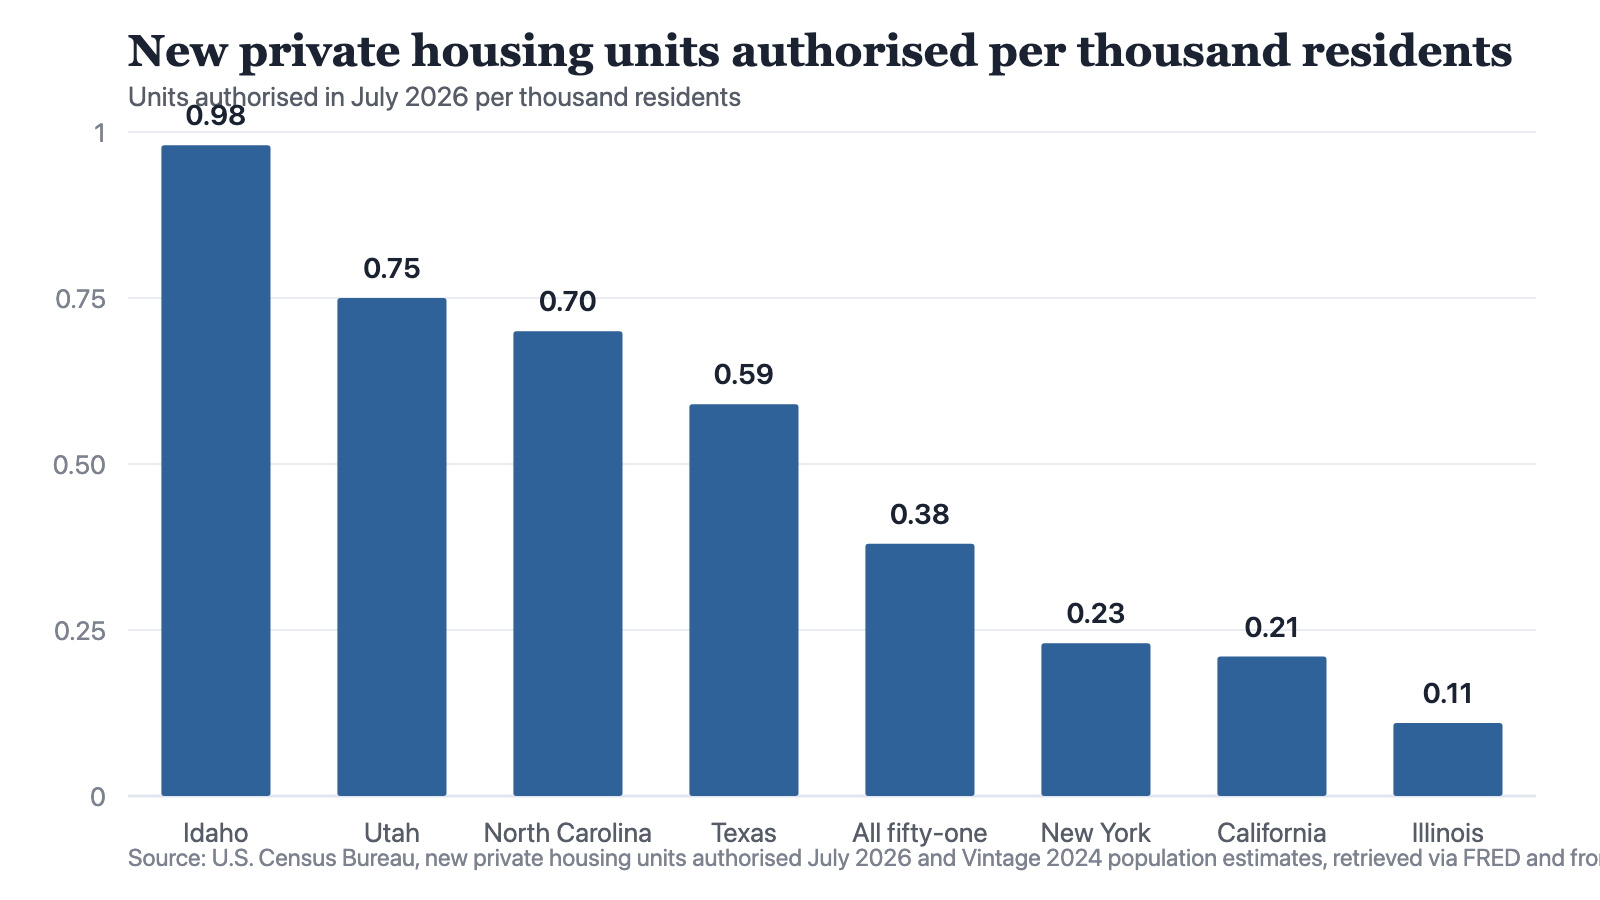
Notes: The permit figures are one month's count. They are not a year, not an annual rate, and no seasonal adjustment is recorded for them. The population estimates are dated 2024 and the permit counts July 2026, so the two are joined across a gap of dates. Seven of the fifty-one jurisdictions are shown, with the fifty-one-jurisdiction total of 128,868 units against 340,110,988 residents.
Source: The Cefa Brief
Chart description
A bar chart of new private housing units authorised in July 2026 per thousand residents. Idaho stands at 0.98, Utah at 0.75, North Carolina at 0.70, Texas at 0.59, all fifty-one jurisdictions together at 0.38, New York at 0.23, California at 0.21 and Illinois at 0.11. The bars fall from left to right. Idaho's bar is 2.58 times the fifty-one-jurisdiction bar; Illinois's is 0.30 times it. The three bars to the right of the fifty-one-jurisdiction bar are each below it.
A bar chart of new private housing units authorised in July 2026 per thousand residents. Idaho stands at 0.98, Utah at 0.75, North Carolina at 0.70, Texas at 0.59, all fifty-one jurisdictions together at 0.38, New York at 0.23, California at 0.21 and Illinois at 0.11. The bars fall from left to right. Idaho's bar is 2.58 times the fifty-one-jurisdiction bar; Illinois's is 0.30 times it. The three bars to the right of the fifty-one-jurisdiction bar are each below it.
The spread runs wider than the two states the argument began with. Idaho at 0.98 units per thousand residents is the highest of the fifty-one jurisdictions. The District of Columbia at 0.05 is the lowest, though the same file records 639 authorisations there in June 2026 against 36 in July, so that bottom reading is one month and not a standing level. Among the fifty states the lowest is Alaska at 0.11. Together the fifty-one authorised 128,868 units in July 2026 against 340,110,988 residents, which is 0.38 per thousand. Idaho sits at 2.58 times that figure and Illinois at 0.30 times it. Top to bottom the spread is 19.09 times.
What authorising more does not buy
Authorising more does not by itself hold appreciation down, and the state at the top of the chart is where that shows. The Federal Housing Finance Agency house price index is set at 100 in the first quarter of 1980, so a state's reading is cumulative appreciation since that date rather than a price level, and two states cannot be ranked on it as though one were dearer than the other. On the readings dated 1 April 2026, Idaho stands at 878.19, or 8.78 times its 1980 base. California stands at 974.97, or 9.75 times. Texas stands at 531.31, or 5.31. Massachusetts at 1326.94 is the highest of the fifty-one and West Virginia at 365.44 the lowest.
Idaho authorised more per resident than any other state in that month and still carries appreciation within a point of California's multiple. Nothing in these files says why, and the index cannot be made to say. That is the reason a federal condition should be written on authorisations and not on prices. A price is an outcome a county council does not control, and it can be moved against that council by a migration it never invited. An authorisation is an act. A jurisdiction that authorises and watches prices rise anyway has done the part that belongs to it. A jurisdiction that authorises almost nothing has not, whatever its prices do.
A price is an outcome a county council does not control. An authorisation is an act.
Where this argument is weakest
Four weaknesses, and the first is the width of the window. Everything above rests on one month. Move back to June 2026 and California authorised 10,013 units rather than 8,285, Idaho 1,660 rather than 1,959, and the ratio between the two falls from 4.66 to 3.27. Utah's count rose 40.2 per cent between those two months and California's fell 17.3 per cent. The direction of the finding survives the change of month. The magnitude does not, and anyone quoting 4.66 as though it were a constant is quoting a summer.
An authorisation is also not a house, which is the second weakness and it cuts at the proposal directly. The series counts permission granted and stops there. A unit authorised in July 2026 may never be built, and the file holds no completions against which to check it. Third, the state is the wrong unit: zoning is written by counties and municipalities, and a state figure is a sum over thousands of separate decisions, so it cannot attribute the result to any one of them. Fourth, demand differs. Idaho and California differ in population growth, in income and in terrain as well as in what their planning boards allow, and nothing here separates those from one another. I have not isolated policy and will not claim to have.
What follows from conceding the point
Concede that the federal government cannot raise supply and the federal task changes shape. It stops being a building programme and becomes a purchase: a payment made to a jurisdiction for an act only that jurisdiction can perform, measured on a series that already exists, published monthly, by an agency with no stake in the answer. What rate that payment should be set at is a question this brief holds no dataset to settle. No figure for any federal programme appears anywhere in this piece, for the same reason.
Two findings would change my mind, and both are checkable on the files quoted here as they extend. If the spread across jurisdictions narrowed towards the fifty-one-jurisdiction figure of 0.38 while national starts stayed near 1.36 million at an annual rate, the constraint would be national after all and a uniform federal instrument would be the right tool. If the states authorising most per resident showed appreciation falling towards the states authorising least, a condition written on prices would beat one written on authorisations and I would switch to it. Neither is what the July 2026 file shows. It shows a spread of 19.09 times between the top and the bottom of one country in one month under one tax code, and a federal argument conducted as though that spread were not there.
About the author

Each author told us that for this piece they hold no interest a reader would think relevant.
This commentary carries its author's name because the view in it is the author's own. An editor reviewed it before publication, which is not the same as agreeing with it. It is not a position of the Center for Economics & Foreign Affairs or of Applied America.
© 2026. The author or authors hold the copyright in this commentary; CEFA publishes it with their permission. This edition, its editing and its presentation are © 2026 Center for Economics & Foreign Affairs. To republish it, see our republication terms. Republishing
Share
The Cefa Brief · applied.thecefa.org/cefa-brief/a-constant-cannot-explain-a-variable · Printed from the web edition