
The fall in unemployment was finished by 2022, and the rate has risen since
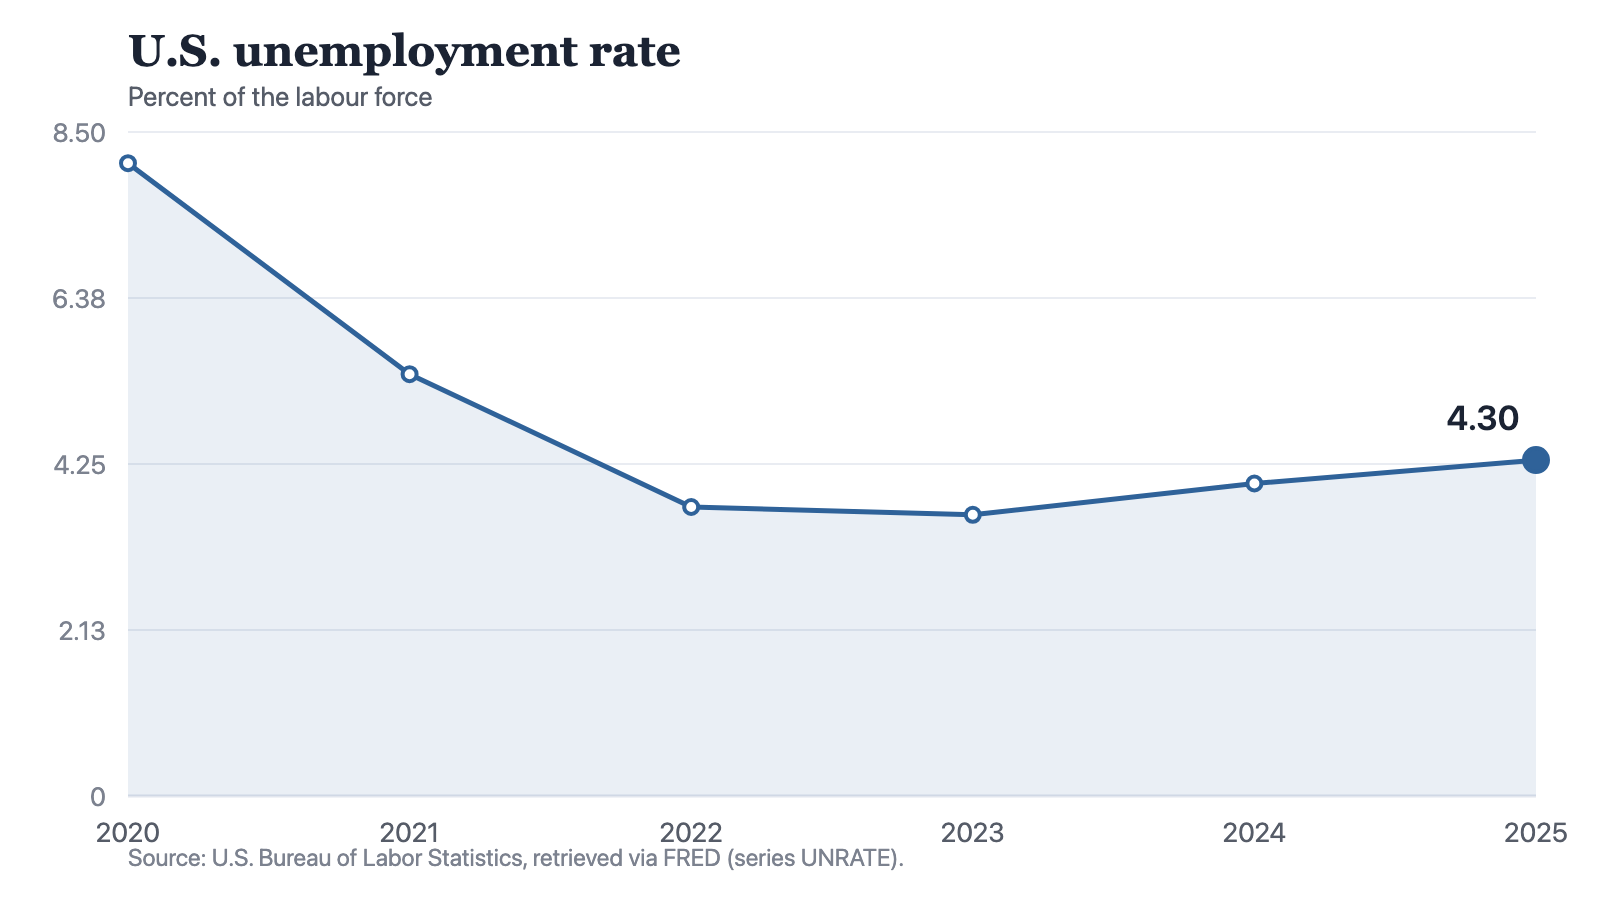
The rate dropped from 8.1 percent in 2020 to 3.7 in 2022, reached a low of 3.6 in 2023, and has risen in both readings since, to 4.3.
by
Published 3 minute read

Illustration: The Cefa Brief
The unemployment rate is usually described as a single arc: it spiked, then it came down. The six annual observations available here do contain that arc, but they place its ending earlier than the description implies, and they contain something the description leaves out entirely. The rate has gone up in each of the last two readings.
The series reads 8.1 percent in 2020, 5.4 in 2021, 3.7 in 2022, 3.6 in 2023, 4 in 2024 and 4.3 in 2025.
The descent finished early
Almost all of the fall is in the first two steps. The rate drops 2.7 points between 2020 and 2021 and another 1.7 between 2021 and 2022. That is 4.4 of the eventual 4.5 point decline, delivered inside two observations.
Notes: Annual observations for the nation as a whole. The rate is a ratio; both the count of unemployed people and the size of the labour force move, and the series does not separate them.
Source: The Cefa Brief
Chart description
A line chart of the U.S. unemployment rate. It falls steeply from 8.1 percent in 2020 to 5.4 in 2021 and 3.7 in 2022, is almost flat at 3.6 in 2023, and then turns upward to 4 percent in 2024 and 4.3 in 2025. The upward section at the right is the only sustained rise in the window.
A line chart of the U.S. unemployment rate. It falls steeply from 8.1 percent in 2020 to 5.4 in 2021 and 3.7 in 2022, is almost flat at 3.6 in 2023, and then turns upward to 4 percent in 2024 and 4.3 in 2025. The upward section at the right is the only sustained rise in the window.
The third step is 0.1 of a point, from 3.7 to 3.6. On a chart that spans 4.5 points it is not a movement at all. Whatever brought the rate down had substantially finished its work by the 2022 observation, and the 2023 reading, usually quoted as the floor, is better read as the same level a year later.
Then the direction reverses. The 2024 reading is 0.4 above 2023 and the 2025 reading is 0.3 above that, a total rise of 0.7 points across two observations. At 4.3, the most recent reading is the highest in the series since 2021.
That is the finding, and it is worth stating without dressing it up. Two consecutive annual rises are not a recession call and nobody should read one into them. They are, however, the first sustained upward movement anywhere in this window, and they have carried the rate seven times further than the entire 2022 to 2023 step it followed.
What a ratio with a moving denominator will not tell you
The unemployment rate has the labour force underneath it, and the labour force counts only people who are working or actively looking. That makes the rate capable of moving for reasons that have nothing to do with anyone losing a job. If people who had stopped looking start looking again, they join the denominator and the numerator at once, and the rate can rise while the labour market improves.
The reverse is equally available. If people stop looking, they leave both, and the rate can fall while fewer people are attached to work. A rise of 0.7 points is therefore consistent with more people out of work, with more people entering the search, or with some mixture. This series cannot referee between them, and any account that assumes the first without saying so has gone beyond the evidence.
These are also annual observations, which means the path inside each year is invisible. A rate that climbed steadily through 2025 and a rate that jumped early and held produce the same point. And the series is national, so it says nothing about any particular state or industry, where the number can differ from the aggregate by a wide margin.
Reading 4.3 against 3.6
For an institution sizing a labour market before committing to a site, the useful pair of numbers is the low and the latest: 3.6 and 4.3. The gap between them is the extent to which national conditions have loosened from their tightest point in this window. It is a modest gap, and it is in the direction that makes hiring easier and wage pressure lighter.
What it is not is a return to anything. The rate remains far below where the window opened, and the descent from 8.1 was real. But that descent has been over for three observations, and a reader still describing American unemployment as falling is describing a period that ended in 2022.
Method and data
The figures are annual observations of the U.S. unemployment rate, published by the U.S. Bureau of Labor Statistics and redistributed by FRED, retrieved for this site on 19 September 2026. They are stated as a percent of the labour force.
The changes quoted here are differences between consecutive observations in that series, in percentage points. They are not monthly changes and not a rate of change of any other kind.
The measure is a ratio. The people counted as unemployed sit on top; the labour force, meaning everyone working or actively looking for work, sits underneath. Both parts move, so the rate can change without the number of people out of work changing, and the series alone does not say which part moved.
These are annual observations covering the nation as a whole. There is no monthly path here, no breakdown by age, sex, education or state, and nothing on how long anyone has been out of work.
How to cite
Jag DeSaint, "The fall in unemployment was finished by 2022, and the rate has risen since," The Cefa Brief, Applied America, March 13, 2025, https://applied.thecefa.org/cefa-brief/unemployment-descent-ended-in-2022.
About the author

Each author told us that for this piece they hold no interest a reader would think relevant.
This Insights piece carries its author's name because the view in it is the author's own. An editor reviewed it before publication, which is not the same as agreeing with it. It is not a position of the Center for Economics & Foreign Affairs or of Applied America.
© 2025. The author or authors hold the copyright in this Insights piece; CEFA publishes it with their permission. This edition, its editing and its presentation are © 2025 Center for Economics & Foreign Affairs. To republish it, see our republication terms. Republishing
Share
The Cefa Brief · applied.thecefa.org/cefa-brief/unemployment-descent-ended-in-2022 · Printed from the web edition