
Administrative capacity should be counted in decisions per qualified head, not in the occupational group that carries its name
Office and Administrative Support is the largest occupational group in the country, 17,753,410 jobs of a 51-state total of 155,495,750. The District of Columbia, where administration is the industry, ranks last of the 51 on it, at 76.871 such jobs per thousand against Tennessee's 129.94.
by
Published 7 minute read

Illustration: The Cefa Brief
Administrative capacity is the explanation of last resort in American policy argument. A programme underspends, a consent takes three years, a grant window closes with money unclaimed, and the diagnosis offered is that the agency lacked capacity. The word is carrying a great deal of weight and it is not attached to anything. Nothing in the data this publication holds measures it, and nothing in that data is named for it.
My position is that administrative capacity should be measured as a rate: decisions completed within a stated period, per qualified head, at the level of government that takes the decision. Not budget. Not establishment. Not the occupational group whose title contains the word. The case against the third substitute is the one that can be settled with published figures, so I will start there and take the harder parts afterwards.
The group named for it is the wrong group
Office and Administrative Support is the largest occupational group in the United States. Summing the 51 state estimates in the 2025 occupational survey gives 17,753,410 jobs, against a 51-state employment total of 155,495,750, or 11.4 percent of all work. The next largest group, food preparation and serving, comes to 13,680,740, some 4,072,670 behind. In 47 of the 51 jurisdictions it is the largest group in the state. It is the obvious instrument, and reaching for it is the first mistake.
The District of Columbia ranks last of the 51 on it. It has 76.871 such jobs per thousand and a location quotient of 0.67, against Tennessee at the top of the list on both measures, with 129.94 and a quotient of 1.14. The jurisdiction that is more nearly an administration than any other place in the country is the one least concentrated in the occupation named administrative. That is not an anomaly to be explained away. It is the measure being honest about its own contents.
What the District is thick with is legal, analytic and managerial labour. Its highest concentration by a distance is legal occupations, at a quotient of 7.08 on 41,700 jobs paying a median of $195,190 a year. Below that, in order, come arts, design and media at 3.68, life, physical and social science at 2.68, business and financial operations at 2.32 on 110,570 jobs, management at 2.1 on 105,590, and computer and mathematical at 1.81 on 43,050. Two of those readings have to be discounted before the rest are used. Arts, design and media is a fact about a capital's press corps rather than about government, and I am not going to pretend it is anything else. The legal figure counts private practice and the lobbying bar alongside any lawyer a government employs, because the survey does not separate them; it is evidence about what the city does, not about who pays for it.
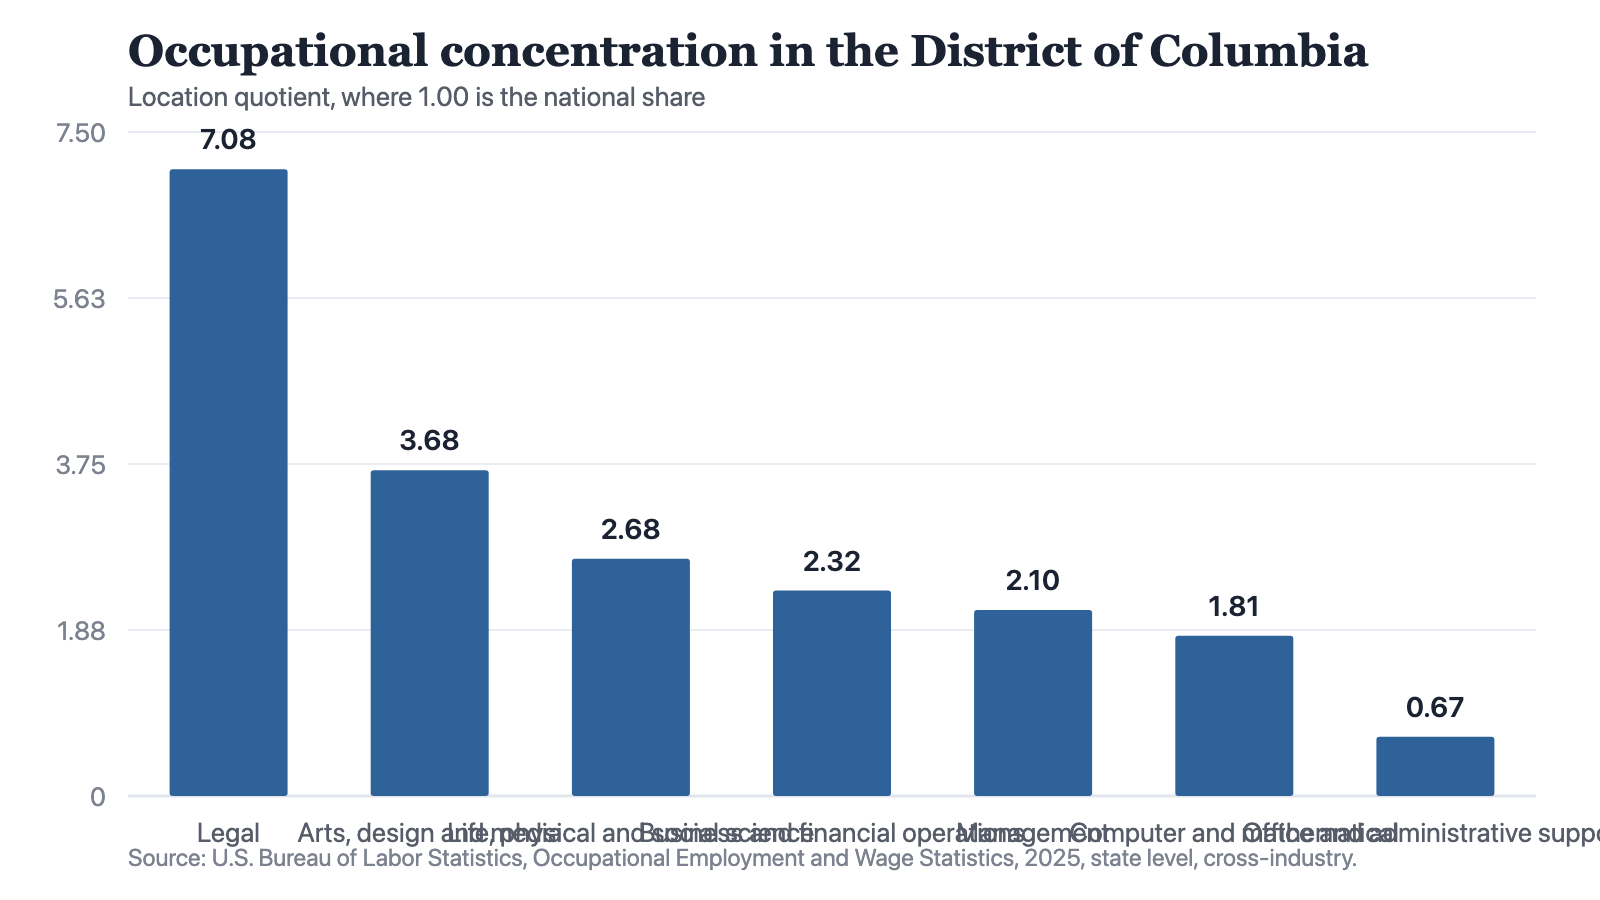
Notes: Source: U.S. Bureau of Labor Statistics, Occupational Employment and Wage Statistics, 2025, state level, cross-industry. A location quotient is the occupation's share of the District's jobs divided by its share of national jobs, so 1.00 is the national share. The full list runs to 22 major groups; office and administrative support is fourteenth of them by concentration, tied with healthcare practitioners. The survey does not distinguish public from private employers, so these figures count government and non-government work together.
Source: The Cefa Brief
Chart description
Seven bars. Legal occupations stand at a location quotient of 7.08, arts, design and media at 3.68, life, physical and social science at 2.68, business and financial operations at 2.32, management at 2.1, computer and mathematical at 1.81, and office and administrative support at 0.67. The six most concentrated groups all sit above the national share of 1.00 and the administrative-support group is the only bar below it.
Seven bars. Legal occupations stand at a location quotient of 7.08, arts, design and media at 3.68, life, physical and social science at 2.68, business and financial operations at 2.32, management at 2.1, computer and mathematical at 1.81, and office and administrative support at 0.67. The six most concentrated groups all sit above the national share of 1.00 and the administrative-support group is the only bar below it.
Read the two facts together. The inference, and it is an inference rather than a finding, is that administration at the level where a government decides things is analytical and legal labour. The clerical group is support for that labour, and support scales with transaction volume rather than with judgement. A jurisdiction that does little but decide will show a thin clerical layer and a thick professional one. That is the shape of the District's profile.
A second reading of the same file should be put on the table, because it cuts across the first. The District pays its office and administrative support workers a median of $60,660, the highest for that group of the 51, against Mississippi's $38,210, the lowest. Fewest per head and best paid is what I would expect from a jurisdiction that has automated or contracted out the routine work and kept the exceptions. I cannot demonstrate that from this file, and it matters here only as a warning: a headcount falls when work is automated, and nothing about the capability has been measured either way.
A stock is not a rate
Suppose the sector problem were repaired tomorrow and the public share of every occupational group were published. Counting heads would still be the wrong measure, because a headcount is a stock and capacity is a rate. Two offices with identical establishments can differ by an order of magnitude in what they finish. The stock records what was hired. It says nothing about what was decided, and the distance between those two things is the whole subject.
Capacity is not what an agency has. It is what an agency completes, divided by what it has.
The output half is in the wrong unit as well
The numerator is in no better condition than the denominator. The nearest thing to a count of completed government decisions in the state-level record this piece draws on is the Census count of new private housing units authorised, and its unit is units. One act of permission can authorise a whole block of dwellings, and every one of them lands in the count. What that series measures is the built environment. What an administrative measure needs is the number of decisions taken, which is a different quantity and is not published beside it.
Volatility gives the game away. The District authorised 639 units in June 2026 and 36 in July, a fall of 603 between two consecutive monthly observations. No administration lost that much capability in a month. The file holds those two observations and no history behind them, and it counts units rather than permissions, so it cannot say whether fewer applications arrived or the same number arrived for smaller buildings. On either reading the movement is a property of what was applied for rather than of the office that handled it.
Performing the division, to show what it yields
It is worth carrying out the calculation the argument would require, because the answer is instructive. Texas authorised 18,391 units in July 2026 and holds 1,725,880 office and administrative support jobs. California authorised 8,285 and holds 1,878,550 of them. The ratios are 0.0107 and 0.0044 to four decimal places. Both are genuine divisions of genuine published numbers and neither of them means anything, because each denominator counts insurance clerks and hospital schedulers alongside anyone working in a county recorder's office, and the file carries no way to tell them apart.
One field would make that calculation mean something. The occupational survey already reports at state level, for every major group, and as a work of the United States government it costs the reader nothing. What it does not report is ownership: it describes itself as cross-industry and carries no line separating public employers from private ones. A published public-sector share for each occupational group, state by state, would turn an uninterpretable ratio into an interpretable one. Whether that share could be produced from what the survey already gathers is a question for the agency and I do not have the answer to it. The point holds either way. The denominator is missing a dimension, and no argument about capacity can be settled until that dimension is published.
Two objections
The first objection is the serious one. A throughput rate rewards the agency that approves everything and punishes the one that reads the file. Scored on decisions completed per head, the least careful regulator in the country wins. I accept that, and it is why the unit proposed above carries a qualifier: decisions completed within a stated period, where the period is the one set in the statute that created the duty. An office clearing its docket by not reading it would fail on reversals and on any quality review such a regime would have to run alongside. Neither a reversal rate nor an elapsed time is published in the record I have, and I would rather say so than borrow a number for the purpose.
Heterogeneity is the second objection, and it is narrower than it looks. A licence renewal and an environmental impact statement are both one decision and are not comparable, so a single count of them cannot usefully be divided by anything. That is an argument for stratifying the count by class of decision, not for abandoning the ratio. Agencies already classify their own work in order to run it. The classification exists; what is missing is its publication. The objection defeats one national number and leaves the measure standing.
There is a reason none of this gets collected, and it is not difficulty. Budget totals have an appropriator who answers for them and headcounts have a personnel office that owns them. Decisions completed per qualified head describe nobody's performance in particular, so nobody has asked for them. That is a reason to expect the gap to last. It is not a reason to keep arguing about capacity as though the word denoted a published quantity.
Until the ratio exists, the defensible sentence names the series and stops there. In 47 of 51 jurisdictions, office and administrative support is the largest occupational group, and the District of Columbia, where administration is the industry, is last of the 51 on it at 76.871 jobs per thousand. A reader can check that in about a minute. Everything past it is inference, and inference in a piece like this one should be signed.
About the author

Each author told us that for this piece they hold no interest a reader would think relevant.
This commentary carries its author's name because the view in it is the author's own. An editor reviewed it before publication, which is not the same as agreeing with it. It is not a position of the Center for Economics & Foreign Affairs or of Applied America.
© 2026. The author or authors hold the copyright in this commentary; CEFA publishes it with their permission. This edition, its editing and its presentation are © 2026 Center for Economics & Foreign Affairs. To republish it, see our republication terms. Republishing
Share
The Cefa Brief · applied.thecefa.org/cefa-brief/the-seat-of-government-ranks-fifty-first · Printed from the web edition