
PerspectivesStates & Communities
The occupation that concentrates pays above its local median in every jurisdiction, and the occupation that spreads pays above it in ten
Computer and mathematical work pays more than the middle job in all fifty-one jurisdictions; production work does so in ten, six of which hold the country's lowest median wages. Production is also the more evenly spread of the two, at or above the national share in 27 jurisdictions against 13.
by
Vantage point
I am an analyst working from published statistics and public documents, and from nothing else. Every figure below is either copied from a federal series or a state-level file held on this site, or arithmetic I performed on those copied figures and can show. What the position gives is comparability: one measure applied on identical terms to all fifty states and the District of Columbia, in a single year, with any absence named rather than filled in. What it cannot give is geography below the state. Agglomeration happens in labour markets smaller than states, in metropolitan areas and single corridors, and no file held here carries a metropolitan area, a county, an employer or a plant. It cannot give direction of travel either. The occupational file is one year and has no predecessor here, so nothing in this piece establishes that any concentration or any wage is rising or falling. That is the blind spot, and it sits directly under the subject: the effect I am writing about occurs at a scale finer than the finest unit I can see. A reader who needs the inside of a siting decision, or the trend, should be told before the first number rather than after the last.
Published 6 minute read

Illustration: The Cefa Brief
The argument about where productive work should sit is conducted almost entirely in national numbers. Manufacturing employment in the United States, in millions of workers, runs 12.1 in 2020, 12.3 in 2021, 12.8 in 2022, 12.9 in 2023, 12.8 in 2024 and 12.6 in 2025. The peak is 2023 and the latest reading is 0.3 million below it. Each of those points is an annual average of a national level, and a national level has no address. The dispute it gets quoted in is a dispute about distribution: on one side the claim that productive activity clusters because clustering pays, on the other the claim that no democracy will accept a map in which most of it is somewhere else. A count of the country cannot adjudicate between them.
Where this is written from
I am an analyst working from published statistics and public documents, and from nothing else. Every figure below is either copied from a federal series or a state-level file held on this site, or arithmetic I performed on those copied figures and can show. What the position gives is comparability: one measure applied on identical terms to all fifty states and the District of Columbia, in a single year, with any absence named rather than filled in. What it cannot give is geography below the state. Agglomeration happens in labour markets smaller than states, in metropolitan areas and single corridors, and no file held here carries a metropolitan area, a county, an employer or a plant. It cannot give direction of travel either. The occupational file is one year and has no predecessor here, so nothing in this piece establishes that any concentration or any wage is rising or falling. That is the blind spot, and it sits directly under the subject: the effect I am writing about occurs at a scale finer than the finest unit I can see. A reader who needs the inside of a siting decision, or the trend, should be told before the first number rather than after the last.
Two occupations, measured the same way
The Bureau of Labor Statistics gives every jurisdiction the same twenty-two occupational groups and, beside each, a location quotient. The file states the definition plainly: the occupation's share of that state's jobs divided by its share of national jobs. At 1.00 the state holds that work in the national proportion. Computer and Mathematical Occupations sit at or above 1.00 in thirteen of the fifty-one jurisdictions and fall below it in the other thirty-eight. The median jurisdiction sits at 0.84. Washington is highest at 2.00; Louisiana and Mississippi are lowest at 0.40.
Production Occupations, taken on the same measure, sit at or above 1.00 in twenty-seven of the fifty-one, two of them exactly at it. The median jurisdiction sits at exactly 1.00. Indiana is highest at 2.01 and the District of Columbia lowest at 0.13. That ordering is the opposite of the one the policy debate assumes. Industrial work, whose absence is the complaint, is on the Bureau's own measure the more evenly distributed of the two, held at or above the national proportion by more than half the country. The work that is genuinely concentrated is the work no instrument proposes to relocate by statute.
The asymmetry is in the pay, not in the map
Set each group's median wage against the median wage of all occupations in the same state and a second structure appears, and it does not run in the same direction as the first. Computer and mathematical work pays above its host state's all-occupation median in all fifty-one jurisdictions. There is no exception to check. The ratio is narrowest in the District of Columbia at 1.45, where the local median is the highest in the country at 91,540 dollars, and widest in California at 2.38. Production work pays above its host state's median in ten jurisdictions and below it in forty-one.
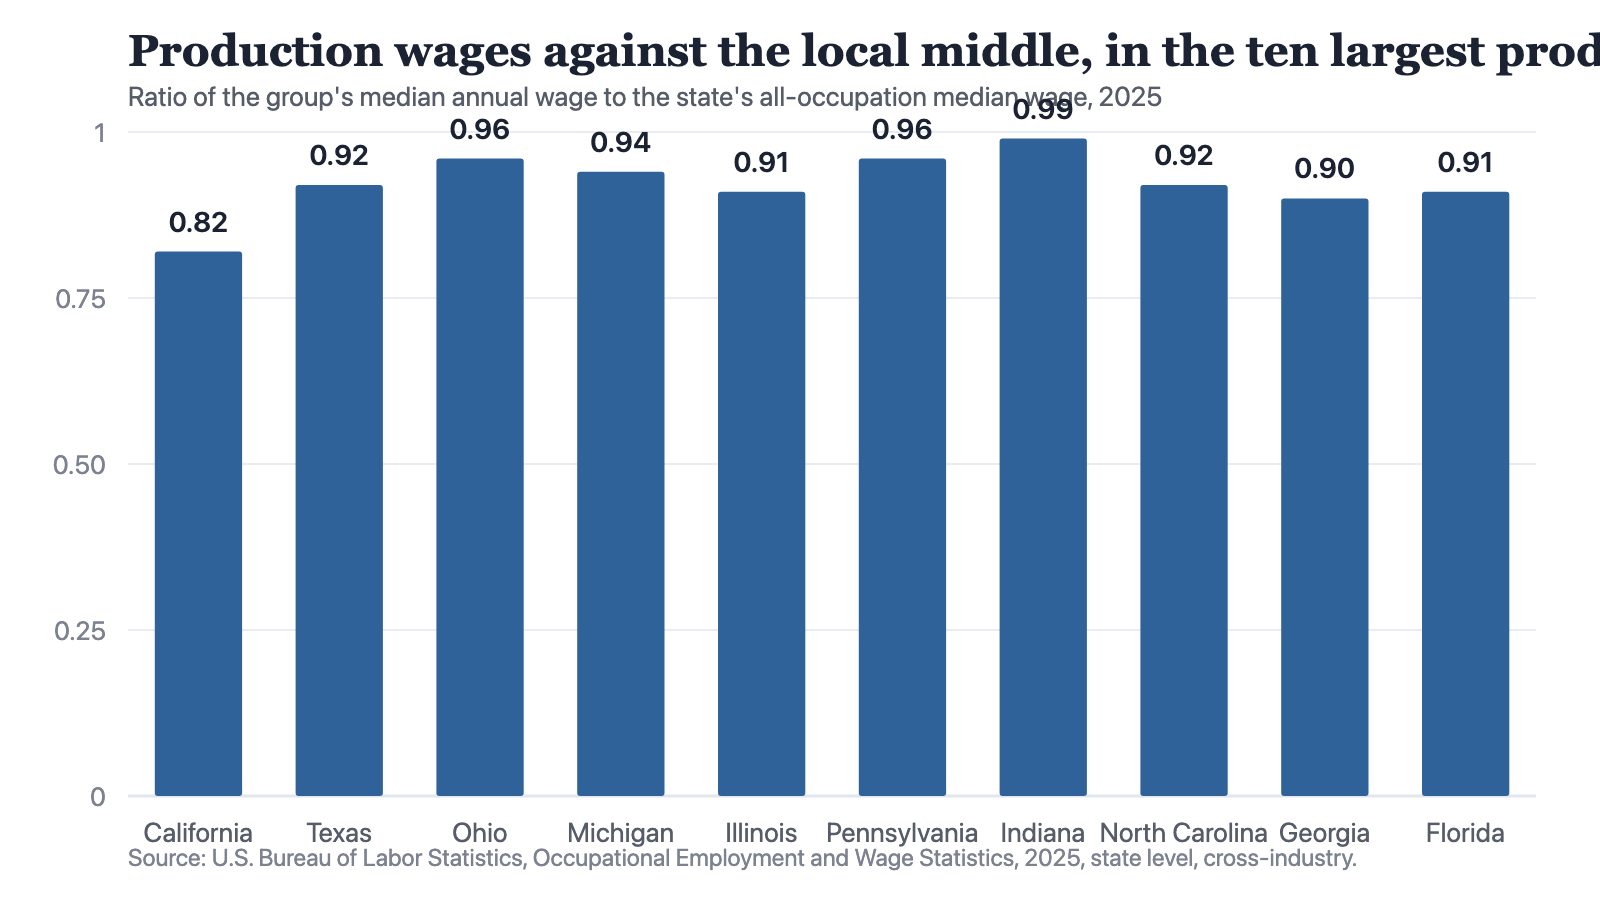
Notes: The ten states were selected by the size of their production workforce, not by the ratio. A value of 1.00 would mean production pays exactly the state's middle wage. Occupational Employment and Wage Statistics, 2025, state level, cross-industry.
Source: The Cefa Brief
Chart description
A bar chart of the ten states with the largest production workforces in 2025, in order of workforce size, showing production median wage as a ratio of the state's own all-occupation median wage: California 0.82, Texas 0.92, Ohio 0.96, Michigan 0.94, Illinois 0.91, Pennsylvania 0.96, Indiana 0.99, North Carolina 0.92, Georgia 0.9 and Florida 0.91. No bar reaches 1.00. Indiana comes closest at 0.99 and California is furthest below at 0.82.
A bar chart of the ten states with the largest production workforces in 2025, in order of workforce size, showing production median wage as a ratio of the state's own all-occupation median wage: California 0.82, Texas 0.92, Ohio 0.96, Michigan 0.94, Illinois 0.91, Pennsylvania 0.96, Indiana 0.99, North Carolina 0.92, Georgia 0.9 and Florida 0.91. No bar reaches 1.00. Indiana comes closest at 0.99 and California is furthest below at 0.82.
Indiana is the strongest case dispersed development has anywhere in this file, and it is therefore the test. The state holds production work at 2.01 times the national proportion, the highest quotient in the country, with 353,630 workers and 110.466 production jobs for every thousand jobs in the state. Production there pays a median of 47,360 dollars against a state all-occupation median of 47,860, which is five hundred dollars below the middle job. Computer and mathematical work in Indiana sits at 0.62, well under the national proportion, and pays 84,010. Indiana has won the thing the policy asks for. It has not won the wage that the argument for the policy promised.
Ten jurisdictions do pay production above their own median: Iowa, Kansas, Kentucky, Louisiana, Mississippi, Missouri, Oklahoma, South Carolina, West Virginia and Wyoming. Six of those ten, namely Kentucky, Louisiana, Mississippi, Oklahoma, South Carolina and West Virginia, are also among the ten lowest all-occupation median wages in the file. Most of the margins are thin. Missouri's production median is 47,810 dollars against a state median of 47,800, ten dollars clear. Iowa's is 48,600 against 48,540. Mississippi's is 41,000 against 40,120, and Mississippi's all-occupation median of 40,120 is the lowest of the fifty-one. Production is the above-median job where the median is lowest, and in Mississippi computer and mathematical work still pays 75,000, which is 1.87 times the state median, on a quotient of 0.40.
Concentration in the work does not predict the premium, and the mismatch is the part worth dwelling on. Most of those ten are not the jurisdictions where production is most concentrated. Wyoming carries the largest production premium in the file, 59,290 dollars against a state median of 50,270, a ratio of 1.18, on a production quotient of 0.85 that is below the national proportion. Louisiana pays 49,890 against 45,520, a ratio of 1.10, on a quotient of 0.96. Turn to the eight jurisdictions most concentrated in the work instead, which are Indiana at 2.01, Alabama at 1.85, Wisconsin at 1.82, Michigan at 1.72, Iowa at 1.66, Kentucky at 1.64, Arkansas at 1.62 and Mississippi at 1.53, and five of the eight pay production below their own median. Holding the industry and paying the premium are separate outcomes, and this file contains states with one and not the other in both directions.
The work that concentrates pays above the local middle in every jurisdiction that holds it. The work that spreads clears the local middle in ten, and in one of them by ten dollars.
The state is too coarse a unit for this
A concession is owed at this point, and it cuts against the neatness of everything above. Ranked by headcount rather than by proportion, the two occupations are not far apart. Eight jurisdictions hold half of all computer and mathematical employment, 2,711,110 jobs of 5,260,080. Ten hold half of production, 4,362,920 of 8,565,750. Measured that way the concentrated occupation and the dispersed one look almost alike, and the reason is that the state is the wrong size of container. Clustering occurs in labour markets smaller than states. Nothing in the record held here is smaller than a state, so the effect under discussion is visible only as a ratio and never directly, which is a limit on the argument and not a point in its favour.
What the tension actually is
Put the two structures side by side and the dispute looks misdescribed. The political demand is not, in the end, that industry be moved, because on the Bureau's measure industry is already the more widely spread of the two kinds of work. The demand is for work that pays above the local middle, and the occupation that reliably does that in every jurisdiction is the one whose concentration no instrument in this field addresses. A plant in a state at 2.01 is a real achievement and it is not a wage premium. Settling the question properly would need a series below the state and a second year, and this record holds neither. Until it does, the defensible statement is the narrow one: in 2025 one kind of work paid above the local middle in all fifty-one jurisdictions and the other in ten.
How to cite
Jag DeSaint, "The occupation that concentrates pays above its local median in every jurisdiction, and the occupation that spreads pays above it in ten," The Cefa Brief, Applied America, February 23, 2026, https://applied.thecefa.org/cefa-brief/the-median-state-is-below-one.
About the author

Each author told us that for this piece they hold no interest a reader would think relevant.
This Perspectives piece carries its author's name because the view in it is the author's own. An editor reviewed it before publication, which is not the same as agreeing with it. It is not a position of the Center for Economics & Foreign Affairs or of Applied America.
© 2026. The author or authors hold the copyright in this Perspectives piece; CEFA publishes it with their permission. This edition, its editing and its presentation are © 2026 Center for Economics & Foreign Affairs. To republish it, see our republication terms. Republishing
Share
The Cefa Brief · applied.thecefa.org/cefa-brief/the-median-state-is-below-one · Printed from the web edition