
Manufacturing output has been below its 2017 level in every year since 2020
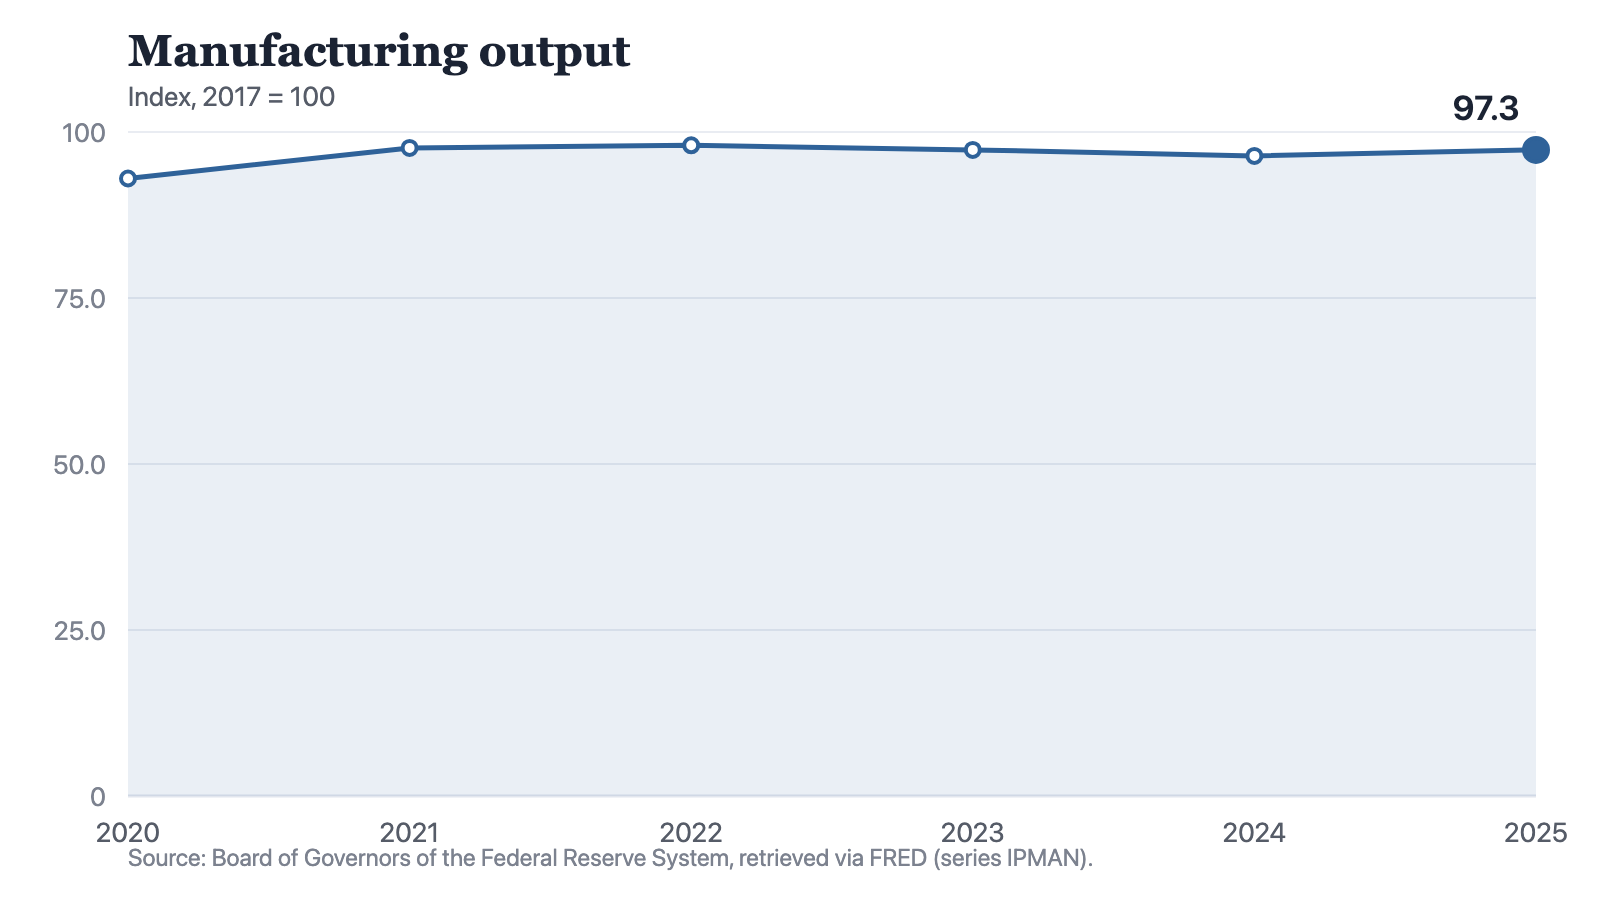
The manufacturing index read 93 on a 2017 base of 100 in 2020 and 97.3 in 2025, with a high of 98 in 2022. Total industrial production, on the same base and from the same board, crossed 100 in 2022 and has stayed above it, and the distance between the two lines has widened at every step since 2021.
by
Published 3 minute read

Illustration: The Cefa Brief
The Federal Reserve publishes two output indices on the same 2017 base. One of them has passed 100. The other has not. Manufacturing output read 93 in 2020 and 97.3 in 2025, and its highest reading in the window is 98, in 2022. In none of the six years did manufacturing reach the level it held in the index's own base year.
Across the window the readings are 93 in 2020, 97.6 in 2021, 98 in 2022, 97.3 in 2023, 96.4 in 2024 and 97.3 in 2025. Each point is the average of that year's monthly index readings. An index has no annual total and none is stated here.
Notes: Annual observations. Each point is the average of that year's monthly index readings, not a total, and the index covers manufacturing only rather than the whole industrial sector.
Source: The Cefa Brief
Chart description
A line chart of the manufacturing output index on a 2017 base of 100, showing 93 in 2020, 97.6 in 2021, 98 in 2022, 97.3 in 2023, 96.4 in 2024 and 97.3 in 2025. Almost all of the movement is the climb between the first two points. The line peaks at 98, falls for two years to its second-lowest reading of 96.4, then recovers to the level it held in 2023. No point on the line reaches 100.
A line chart of the manufacturing output index on a 2017 base of 100, showing 93 in 2020, 97.6 in 2021, 98 in 2022, 97.3 in 2023, 96.4 in 2024 and 97.3 in 2025. Almost all of the movement is the climb between the first two points. The line peaks at 98, falls for two years to its second-lowest reading of 96.4, then recovers to the level it held in 2023. No point on the line reaches 100.
Almost all of it was the bounce
Year on year the index added 4.6 points, then 0.4, then gave back 0.7, then 0.9, then added 0.9. The whole series spans 5 points, from 93 to 98, and 4.6 of those 5 are the single move out of 2020. From 2021 onward the readings have run inside a band 1.6 points wide, between 96.4 and 98. Four years on from 2021 the index stands 0.3 points lower than it did then.
The same base, a different distance from it
Total industrial production comes from the same board, sits on the same 2017 base, and carries manufacturing together with mining and utilities. It reads 95.1 in 2020, 99.3 in 2021, 101 in 2022, 100.8 in 2023, 100.1 in 2024 and 101.2 in 2025. It crossed 100 in 2022 and has stayed above it in every year since. Manufacturing has been below 100 throughout.
Stated as distances from the shared base, the 2025 readings are 1.2 points above it for total industry and 2.7 points below it for manufacturing. The gap between the two lines was 1.7 points in 2021, then 3, then 3.5, then 3.7, then 3.9. It has widened at every step since 2021. The single year it narrowed was 2021 itself, when it came in at 1.7 against 2.1 the year before.
Both indices share a base, so the difference between them is a difference in how far each aggregate stands from its own 2017 self. It is not a decomposition. This site holds the two index lines and not the weights that join them, so nothing here establishes how large manufacturing is inside total industrial output, or what mining and utilities did. A reader who converts 3.9 index points into a statement about non-manufacturing industry has gone past the evidence.
On a 2017 base of 100, manufacturing read 97.3 in 2025. American factories made 2.7 percent less than they did in the base year, and every claim of a manufacturing revival has to pass through that number.
The last point breaks the run and matches an older one
Two falls came in succession, from 98 to 97.3 and then to 96.4. The step after them turned up by 0.9 points, to 97.3, which is the 2023 reading exactly. Manufacturing output has spent two years going down and one coming back to a level it already held, and the 2025 reading is still 0.7 points below the 2022 high. One upward step after two downward ones is consistent with a floor and equally consistent with a series moving about inside a narrow band.
What an output index will not settle
Six annual observations cannot show a turning point inside a year. An output index is also not employment, not capital spending, not value added and not profit, and it should not be asked to answer for any of them. It reports how much was made relative to 2017, and says nothing about who made it, in which states, or at what margin.
The defensible sentences here are short ones. Manufacturing output has not matched its 2017 level in any year since 2020. Total industrial output passed that level in 2022 and has held above it. The distance between the two has grown in each of the last four years. Whether the rise into 2025 is a floor or an oscillation is not in these figures, and the honest answer to a reader who wants one is that a seventh reading will give it.
Method and data
The figures are annual observations of the manufacturing output index, series IPMAN, published by the Board of Governors of the Federal Reserve System, redistributed by FRED and retrieved for this site on 19 September 2026. The unit is an index with 2017 set to 100, so a reading states real manufacturing output relative to that single year and is not a quantity, a value or a count of anything. Each annual point is the average of that year's monthly index readings, which is the index level for the year and never a total, because an index has no total to state. The series covers manufacturing alone. It is not employment, not capital spending, not value added and not profit, and it carries no dollar figure at any point. The industrial production index quoted for contrast, series INDPRO, comes from the same board on the same 2017 base and carries manufacturing, mining and utilities together. The two are set beside each other here only as distances from a base they share; no figure on this page is divided by another, and nothing here weights one index into the other or establishes what the non-manufacturing part of industry did. Six annual points cannot show anything that happened inside a year.
How to cite
Jag DeSaint, "Manufacturing output has been below its 2017 level in every year since 2020," The Cefa Brief, Applied America, December 4, 2025, https://applied.thecefa.org/cefa-brief/the-base-year-is-still-ahead.
About the author

Each author told us that for this piece they hold no interest a reader would think relevant.
This Insights piece carries its author's name because the view in it is the author's own. An editor reviewed it before publication, which is not the same as agreeing with it. It is not a position of the Center for Economics & Foreign Affairs or of Applied America.
© 2025. The author or authors hold the copyright in this Insights piece; CEFA publishes it with their permission. This edition, its editing and its presentation are © 2025 Center for Economics & Foreign Affairs. To republish it, see our republication terms. Republishing
Share
Related
- Perspectives
Productive capacity names a quantity that no series on this site reports
Of the fifty-eight annual series in the file behind this site, one carries the word capacity in its title, and it reports a percentage of capacity rather than an amount of it. What stands in are four measures of four different things, and they moved in different directions over the same three years.
- Perspectives
Industrial strategy is a decade-long commitment made by institutions that are not built to hold one
Spending on manufacturing plant rose from a yearly rate of 75 billion dollars in 2020 to 244 in 2024, lifting the factory share of all nonresidential building from 8.8 percent to 18.8. Manufacturing employment reached its high for these six years in 2023 and is lower now, which is what it looks like when a country can order buildings faster than the institutions to run them.

The Cefa Brief · applied.thecefa.org/cefa-brief/the-base-year-is-still-ahead · Printed from the web edition