
Core capital-goods orders took three years to return to their 2022 figure
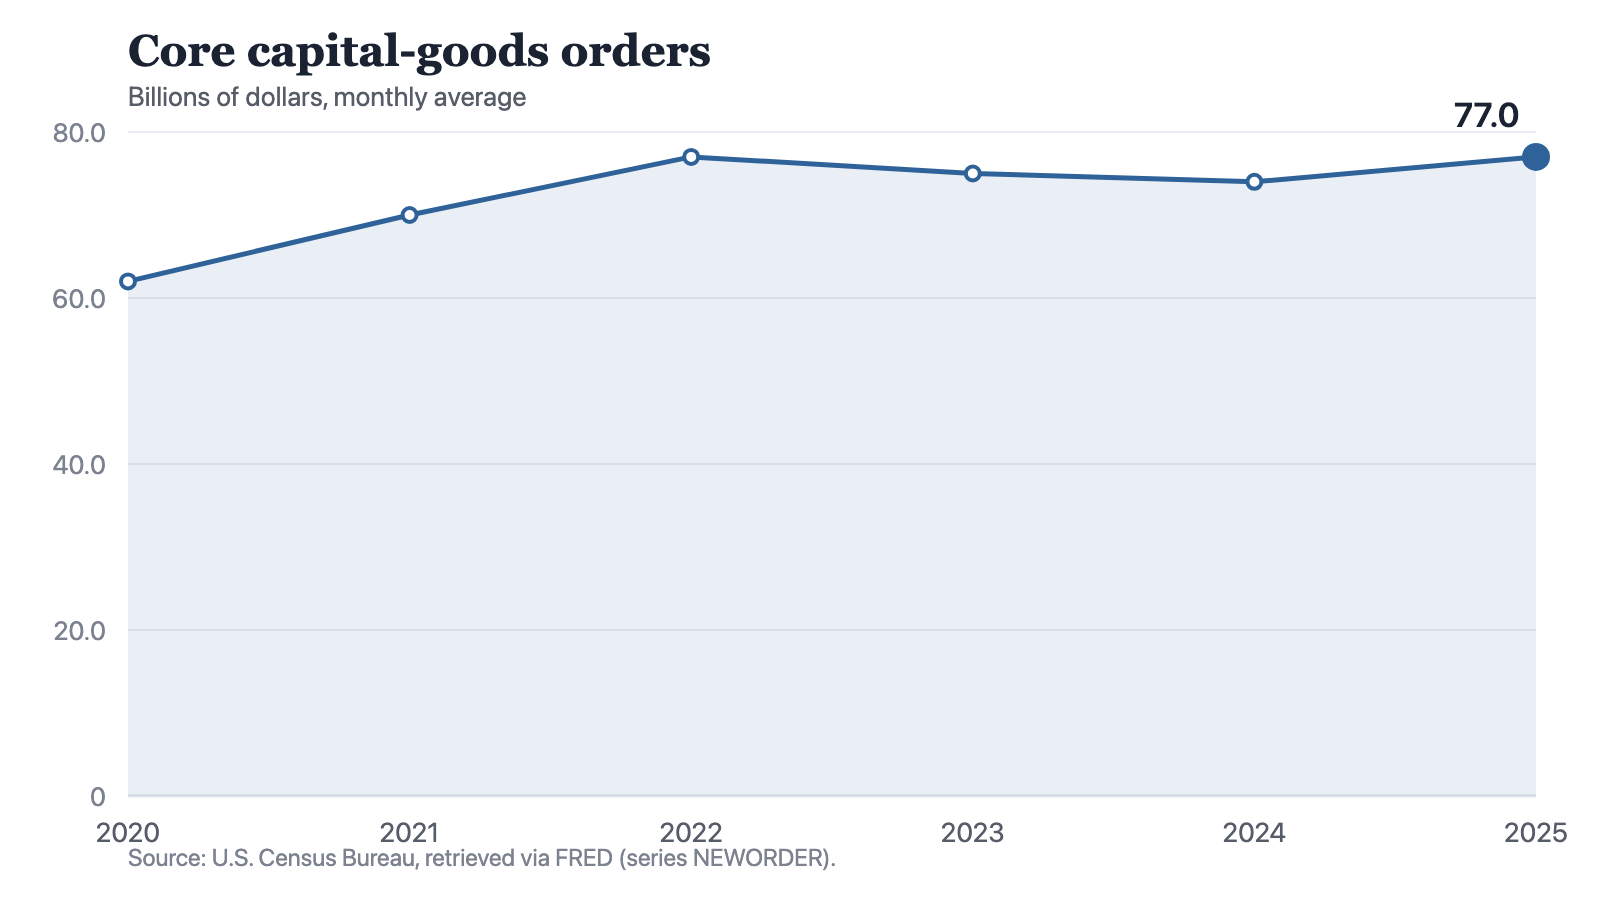
The monthly average rose from 62 billion dollars in 2020 to 77 in 2022, then ran 75, 74 and back to 77. The figure counts dollars and is not adjusted for prices, so a return to the same number is not a return to the same order book.
by
Published 2 minute read

Illustration: The Cefa Brief
Core capital-goods orders stood at 77 billion dollars a month in 2022. In 2025 they stood at 77 billion dollars a month. Between those two readings the series fell to 75 and then to 74, so the three years after 2022 added nothing to the figure. The two years before 2022 added 15 billion.
The six annual readings are 62 billion dollars a month in 2020, 70 in 2021, 77 in 2022, 75 in 2023, 74 in 2024 and 77 in 2025. Each figure is the average of that year's monthly observations, not a total for the year.
Notes: Annual observations. Each point is the average of the periods within the year, not the year’s total.
Source: The Cefa Brief
Chart description
A line chart of core capital-goods orders as a monthly average: 62 billion dollars in 2020, 70 in 2021, 77 in 2022, 75 in 2023, 74 in 2024 and 77 in 2025. The line climbs for two years, eases for two, and ends level with its 2022 reading.
A line chart of core capital-goods orders as a monthly average: 62 billion dollars in 2020, 70 in 2021, 77 in 2022, 75 in 2023, 74 in 2024 and 77 in 2025. The line climbs for two years, eases for two, and ends level with its 2022 reading.
Where the movement was
Year on year the series added 8 billion, then 7, then gave back 2, then 1, then added 3. The first two steps together are worth 15 billion a month. The last three sum to nothing. The lowest reading of the second half is 74 in 2024, which sits 3 billion below the 2022 figure, and that 3 billion is the whole of the decline this series records.
The wider order book did not stand still
Total manufacturers' new orders, a broader Census series on the same monthly-average basis, ran 589 billion dollars a month in 2022, 591 in 2023, 587 in 2024 and 611 in 2025. That series also dipped below its 2022 reading, by 2 billion in 2024, and then finished 22 billion above it. The core capital-goods figure finished level. Two series from one agency describe the same soft patch and two different exits from it.
What an unchanged figure does not settle
Two things limit every reading above. The first is the unit. Each point is an average of the year's months, so 77 billion dollars describes a typical month of 2025 and not the year; a reader who treats it as annual orders is out by about a factor of twelve. The second is that the series counts dollars rather than machines, with no adjustment for prices. Nothing on this page separates price from quantity, so an unchanged dollar figure across three years does not establish an unchanged quantity of equipment ordered, in either direction.
The series also has a defined edge. It counts orders, which are commitments placed rather than goods shipped or output produced, and it leaves out defence orders and aircraft by construction. That is what the word core carries. So this is not a measure of what American factories built, and not a measure of total business capital spending. Anyone reaching for either of those needs a different series, and should say which one.
What would change the answer is a fourth reading. One year level with 2022 is consistent with a series that has found a floor and turned up, and equally with one oscillating around 77 billion dollars a month. The three readings after 2022 are 75, 74 and 77. On that evidence the defensible statement is that core capital-goods orders have not advanced since 2022, and that whether 2025 starts a recovery or repeats a plateau is not yet in the data.
Method and data
The figures are annual observations of core capital-goods orders, series NEWORDER, published by the U.S. Census Bureau, redistributed by FRED and retrieved for this site on 19 September 2026. The unit is billions of dollars as a monthly average, which means each annual point is the average of that year's monthly observations and not the year's total; reading 77 billion dollars as a year of orders would be wrong by about a factor of twelve. The series counts new orders, which are commitments placed rather than goods shipped or output produced, and it excludes defence orders and aircraft by construction. It is not adjusted for prices, so it does not separate the number of things ordered from what they cost, and nothing in this piece produces a real or price-adjusted orders figure. The broader orders series quoted in the text is a separate Census series named for contrast only; no figure here is divided by another.
How to cite
Jag DeSaint, "Core capital-goods orders took three years to return to their 2022 figure," The Cefa Brief, Applied America, April 23, 2026, https://applied.thecefa.org/cefa-brief/fifteen-billion-then-nothing.
About the author

Each author told us that for this piece they hold no interest a reader would think relevant.
This Insights piece carries its author's name because the view in it is the author's own. An editor reviewed it before publication, which is not the same as agreeing with it. It is not a position of the Center for Economics & Foreign Affairs or of Applied America.
© 2026. The author or authors hold the copyright in this Insights piece; CEFA publishes it with their permission. This edition, its editing and its presentation are © 2026 Center for Economics & Foreign Affairs. To republish it, see our republication terms. Republishing
Share
The Cefa Brief · applied.thecefa.org/cefa-brief/fifteen-billion-then-nothing · Printed from the web edition