
Federal debt rises every year but the annual addition has no trend
The stock goes from 28.7 to 37.1 trillion dollars across five observations. The four annual additions behind that run 2.1, 1.9, 2.6 and 1.8 trillion, and the most recent is the smallest of them.
by
Published 3 minute read

Illustration: The Cefa Brief
Five observations of the federal debt stock: 28.7 trillion dollars in 2021, 30.8 in 2022, 32.7 in 2023, 35.3 in 2024 and 37.1 in 2025. The balance is larger at every reading. That is the part everyone quotes, and it is the least informative part.
The informative quantity is the gap between consecutive readings, because that is what a year of fiscal decisions adds to the balance. Those gaps are 2.1 trillion dollars, then 1.9, then 2.6, then 1.8. They total 8.4 trillion across four years.
The additions go down, then up, then down
There is no direction in that sequence. The addition falls from 2.1 to 1.9, rises to 2.6, then falls to 1.8. The range across the four is 0.8 trillion dollars, which is nearly half the size of the smallest of them. The most recent addition, 1.8 trillion, is the smallest in the window.
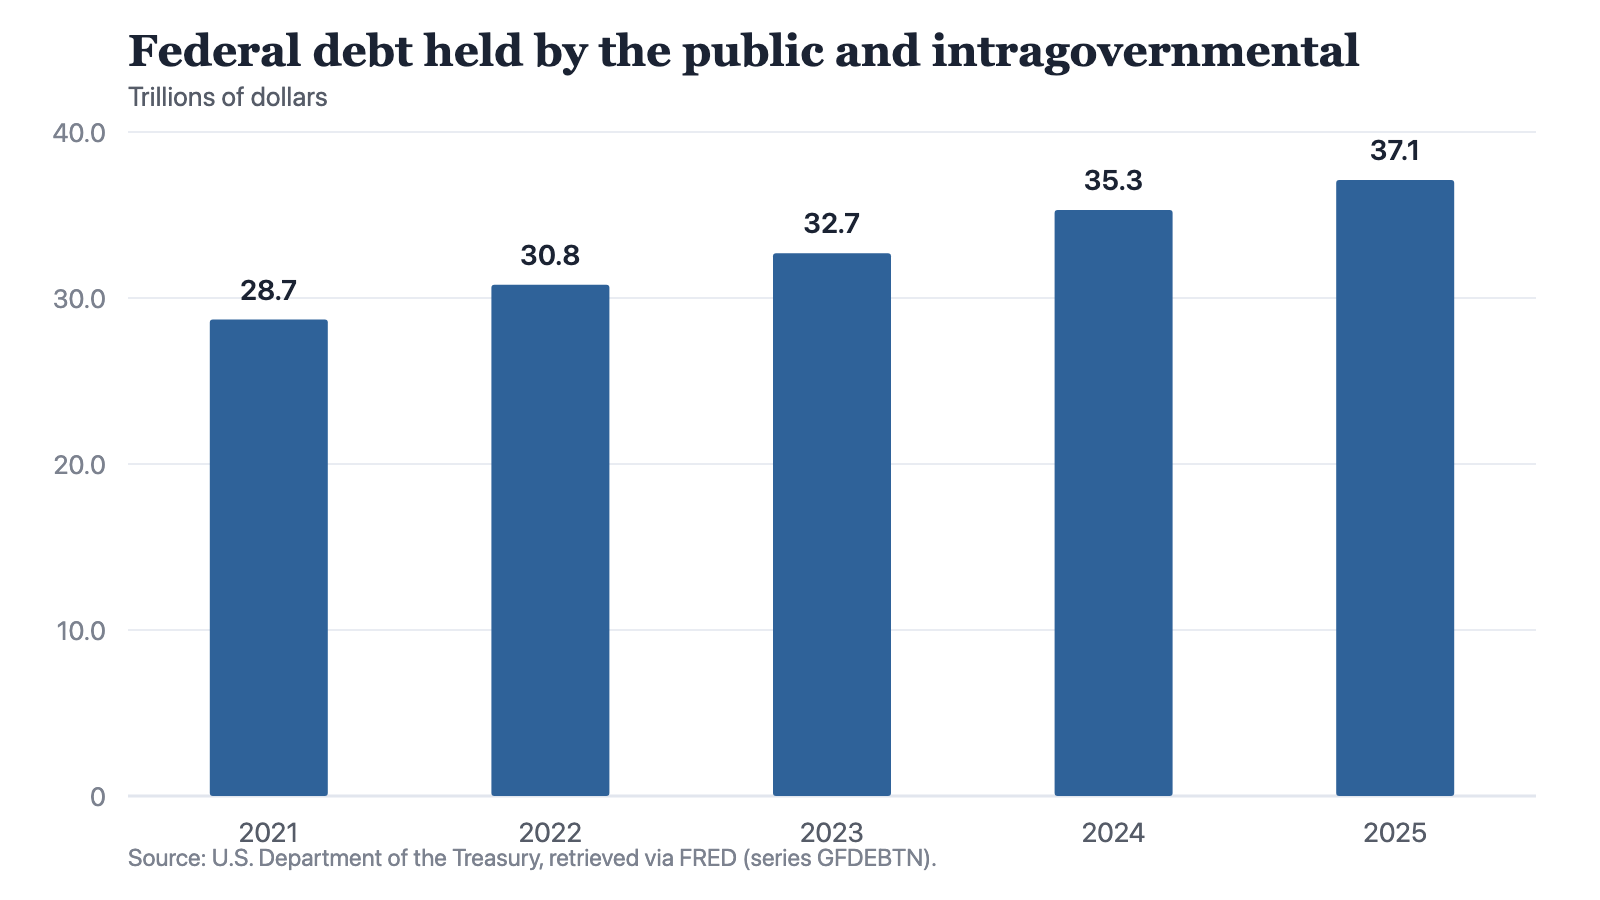
Notes: A gross total including debt the federal government owes to its own accounts, and therefore larger than debt held by the public alone. This is a stock outstanding, not a deficit. The 2025 figure reflects the period available at retrieval.
Source: The Cefa Brief
Chart description
A bar chart of the federal debt balance showing 28.7 trillion dollars in 2021, 30.8 trillion in 2022, 32.7 trillion in 2023, 35.3 trillion in 2024 and 37.1 trillion in 2025. Every bar is taller than the one before, and the visual differences between consecutive bars are similar in size, with the step into 2024 slightly the largest and the step into 2025 slightly the smallest.
A bar chart of the federal debt balance showing 28.7 trillion dollars in 2021, 30.8 trillion in 2022, 32.7 trillion in 2023, 35.3 trillion in 2024 and 37.1 trillion in 2025. Every bar is taller than the one before, and the visual differences between consecutive bars are similar in size, with the step into 2024 slightly the largest and the step into 2025 slightly the smallest.
This is the ordinary trap of a cumulative series. A balance that only goes up produces a chart that only goes up, and the chart then reads as acceleration whether or not anything is accelerating. Here nothing is. The bars get taller because each year adds to a total that already exists.
Read the differences instead and the picture is a fiscal position adding somewhere between 1.8 and 2.6 trillion dollars a year, without an evident direction across four attempts to find one.
One structural point about the window. This series carries five observations and begins in 2021, where the interest rate series in the same file carry six and begin in 2020. Any sentence that opens with the words since 2020 cannot be completed from this series. The first year of the period most readers have in mind is not here, and the 8.4 trillion dollars counted above is a four-year total rather than a five-year one.
What this series is, and what it is not
It is gross debt. The title on the series says so: it counts debt held by the public together with intragovernmental holdings, which is to say borrowing the government has done from its own accounts. That number is larger than debt held by the public, and the two figures are routinely swapped in public argument by people who want the bigger one.
It is also a stock rather than a flow, so the annual changes here are changes in a balance. They are close cousins of the deficit but not the same object, and this publication does not hold a published deficit series to check them against.
There is also something absent that matters more than anything present. The file holds the size of the balance but carries no series for the cost of carrying it. Interest paid is the quantity most arguments about federal debt are actually reaching for, and it depends on the rates at which the balance was issued and is refinanced, not on the balance alone. We can report what is owed. We cannot, from this file, report what it costs, and the gap between those two things is where most of the argument lives.
The comparison worth making, and the one worth refusing
Current-dollar gross domestic product over the overlapping years runs 26.1 trillion dollars in 2022, 27.8 in 2023, 29.3 in 2024 and 30.8 in 2025. Against debt of 30.8, 32.7, 35.3 and 37.1 trillion in the same years, the balance outstanding is larger than a year of output at every one of the four.
That is as far as this data goes, and we stop there deliberately. Dividing one by the other yields the number everybody wants, and it is a number this publication does not hold: a stock measured at a moment and a flow measured across a year are not the same kind of quantity, and a ratio between them requires a stated convention about which vintage, which debt concept and which output measure. None of that is in the file, so the ratio is not printed.
What five observations support is narrow and worth having anyway. The balance has risen at every reading. The annual addition has moved in both directions and is smallest in the latest year. Anyone arguing that the pace of borrowing is accelerating is not getting that from this series, and neither is anyone arguing the opposite.
Method and data
The debt figures are annual observations of federal debt held by the public together with intragovernmental holdings, published by the U.S. Department of the Treasury and redistributed by FRED, retrieved for this site on 19 September 2026, and recorded here in trillions of dollars.
This is a gross total. It includes debt the federal government owes to its own accounts, so it is larger than the figure for debt held by the public alone, and the two should never be quoted interchangeably.
It is a stock, not a flow. It is the size of a balance outstanding, not the deficit in any year, and the annual changes computed here are changes in that balance rather than published deficit figures.
Where gross domestic product appears, it is the current-dollar annual total published by the Bureau of Economic Analysis from the same retrieval. A debt stock and an annual flow of output are differently constructed quantities. No ratio of one to the other is published in this publication's data file and none is computed here.
There are five observations, beginning in 2021. The 2025 figure reflects the period available at retrieval. Four annual changes cannot establish a trend and are not treated as one.
How to cite
Jag DeSaint, "Federal debt rises every year but the annual addition has no trend," The Cefa Brief, Applied America, April 8, 2025, https://applied.thecefa.org/cefa-brief/federal-debt-increment-has-no-trend.
About the author

Each author told us that for this piece they hold no interest a reader would think relevant.
This Insights piece carries its author's name because the view in it is the author's own. An editor reviewed it before publication, which is not the same as agreeing with it. It is not a position of the Center for Economics & Foreign Affairs or of Applied America.
© 2025. The author or authors hold the copyright in this Insights piece; CEFA publishes it with their permission. This edition, its editing and its presentation are © 2025 Center for Economics & Foreign Affairs. To republish it, see our republication terms. Republishing
Share
The Cefa Brief · applied.thecefa.org/cefa-brief/federal-debt-increment-has-no-trend · Printed from the web edition