
InsightsInternational Partners
Nearly two thirds of the five-year export gain arrived in a single year
Exports of goods and services rose 0.47 trillion dollars in 2022 and then 0.03, 0.15 and 0.10. A series that never falls looks like steady growth until you write it as steps, at which point it looks like one event followed by three quiet years.
by
Published 3 minute read

Illustration: The Cefa Brief
Exports of goods and services have not fallen once in the five years this site holds. That is the first thing anyone notices about the series, and it is the least useful thing in it.
The readings are 2.57 trillion dollars in 2021, 3.04 in 2022, 3.07 in 2023, 3.22 in 2024 and 3.32 in 2025. Written as steps rather than levels, the run is 0.47, then 0.03, then 0.15, then 0.10. The total gain across the window is 0.75 trillion, and 0.47 of it — 63 percent — arrived in the first step.
One step is not a trajectory
A series that never declines invites the language of steady growth. This one does not earn it. Set aside the 2022 observation and what remains is three years in which exports added 0.28 trillion dollars in total, an average annual step of under 0.1 against a base above 3. The 2023 step of 0.03 is the smallest movement anywhere in the series, of either sign.
The shape matters more than the direction because of what a single dominant step usually is. A one-year jump of that size followed by three small ones is the signature of a level shift — a repricing, a post-disruption catch-up, a change in what is being counted — rather than of an export sector picking up speed. This dataset has no country, commodity or sector detail and no deflated series, so I cannot tell you which of those it was. What the series does establish is that whatever produced the 2022 step has not recurred in any of the three years since.
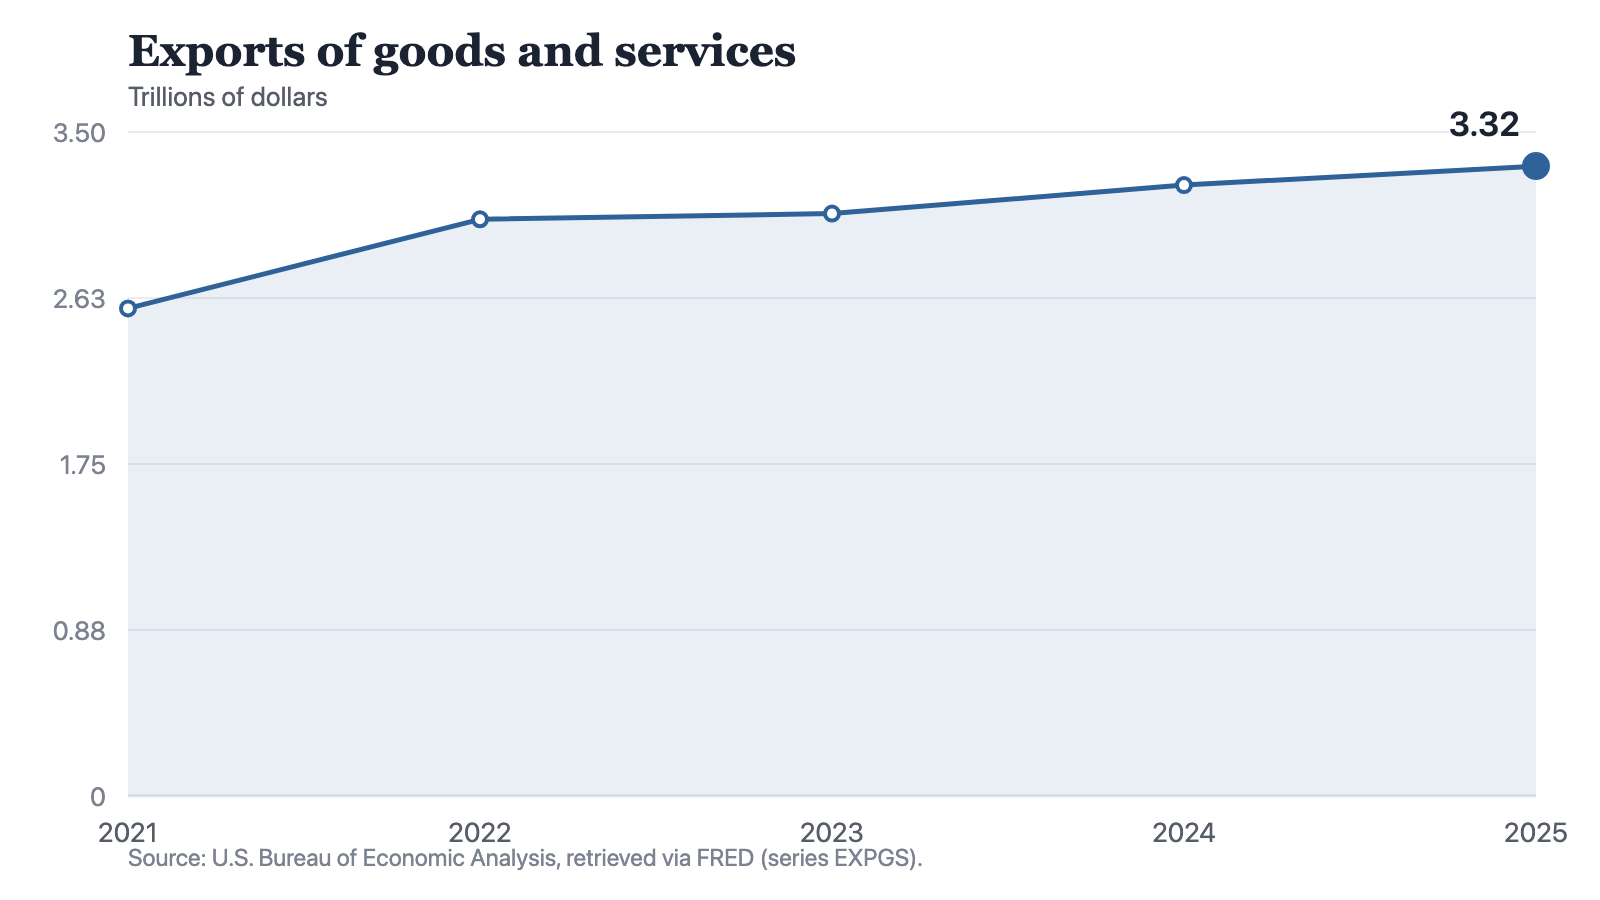
Notes: Current dollars. Services are included in the total. Source: U.S. Bureau of Economic Analysis, retrieved via FRED (series EXPGS). Retrieved 19 September 2026.
Source: The Cefa Brief
Chart description
The line rises in every observation but at very uneven rates. It climbs steeply from 2.57 trillion dollars in 2021 to 3.04 in 2022, a step of 0.47. It then almost flattens at 3.07 in 2023, a step of 0.03, before rising to 3.22 in 2024 and 3.32 in 2025, steps of 0.15 and 0.10. No observation in the series is lower than the one before it.
The line rises in every observation but at very uneven rates. It climbs steeply from 2.57 trillion dollars in 2021 to 3.04 in 2022, a step of 0.47. It then almost flattens at 3.07 in 2023, a step of 0.03, before rising to 3.22 in 2024 and 3.32 in 2025, steps of 0.15 and 0.10. No observation in the series is lower than the one before it.
2023, the year both trade lines went quiet
The near-stall in 2023 is not confined to exports. In the same year, imports of goods and services fell for the only time in their own five-year run, from 3.97 to 3.86. Both sides of the trade account recorded their weakest observation in the same twelve months, one as a stall and the other as a decline.
That coincidence has an obvious candidate cause, and it is not a collapse in trading activity. The producer price index for all commodities fell that year, from 264.5 to 255.7, having risen from 227.3 to 264.5 the year before. When two current-dollar totals both go quiet in a year that goods prices came off a peak, the most economical explanation is the unit rather than the quantity. I cannot prove that from these files — the producer index is a domestic measure, not a trade price index, and this site holds no deflated trade series — but a reader who treats 2023 as a real contraction in trade is choosing the less likely of two readings without acknowledging that there is a choice.
Two series stalling in the same year is either a fact about the world or a fact about the dollars they are counted in. The data here cannot tell them apart, and the difference is everything.
Against the economy it sits inside
The comparison that gives the three quiet years their weight is with output. Current-dollar GDP in this dataset runs 26.1 trillion in 2022, 27.8 in 2023, 29.3 in 2024 and 30.8 in 2025. Over exactly those intervals exports went from 3.04 to 3.32. Output added 4.7 trillion dollars. Exports added 0.28.
Both are current-dollar series compiled separately, and the only operation I am performing on them is subtraction, which is all they will bear. But the direction is not ambiguous, and the same nominal caveat weighs on both sides of it. Since 2022, the external side of the American economy has grown considerably more slowly than the domestic side. That is a fact about composition, and composition is what changes slowly and matters longest.
What the series will and will not support
It will support this: exports have risen in every year on record here, the total is at its highest in 2025, and the entire five-year gain is dominated by one observation three years old. It will not support a claim about volumes, because the totals are nominal. It will not support a claim about any market or product, because there is no such detail here. And it will not support a forecast, because five annual points with one dominant step are precisely the shape that produces confident extrapolations and wrong ones.
There is a habit in export reporting of quoting the level and the sign — a record year, up again — and stopping there. On this series both statements are true every single year, which is what makes them worthless. The information is in the steps, and the steps say that American exports had one good year in 2022 and have been keeping pace with nothing in particular since.
Method and data
Exports here are the series EXPGS from the U.S. Bureau of Economic Analysis, redistributed by FRED and retrieved for this site on 19 September 2026. The series title is Exports of goods and services: services are inside these totals, not additional to them. The figures are annual and in trillions of current dollars.
Because the totals are in current dollars, every year-on-year change mixes price with volume. This site holds no deflated export series, so no figure in this piece is a volume and none should be read as one. The step sizes quoted are subtractions between published annual levels, nothing more.
Imports are the series IMPGS and the producer price index for all commodities is PPIACO, both annual and retrieved on the same date. They appear only to place the 2023 observation in context. PPIACO measures prices received by domestic producers; it is not an index of export prices and is not a substitute for one.
Current-dollar GDP is series GDP, held on this site from 2022. Comparisons between the export total and GDP here are arithmetic on two separately compiled current-dollar series and carry the limitations of both. No share is computed from them.
The export series on this site begins at 2021, so there are five observations. No pre-2021 comparison is possible from these files, and there is no country, commodity or sector detail anywhere in them.
Data sources
- U.S. Bureau of Economic Analysis, exports of goods and services (series EXPGS), retrieved via FRED (external site)
- U.S. Bureau of Economic Analysis, imports of goods and services (series IMPGS), retrieved via FRED (external site)
- U.S. Bureau of Labor Statistics, producer price index, all commodities (series PPIACO), retrieved via FRED (external site)
- U.S. Bureau of Economic Analysis, gross domestic product (series GDP), retrieved via FRED (external site)
How to cite
Jag DeSaint, "Nearly two thirds of the five-year export gain arrived in a single year," The Cefa Brief, Applied America, September 2, 2026, https://applied.thecefa.org/cefa-brief/exports-one-step-then-four-flat-years.
About the author

Each author told us that for this piece they hold no interest a reader would think relevant.
This Insights piece carries its author's name because the view in it is the author's own. An editor reviewed it before publication, which is not the same as agreeing with it. It is not a position of the Center for Economics & Foreign Affairs or of Applied America.
© 2026. The author or authors hold the copyright in this Insights piece; CEFA publishes it with their permission. This edition, its editing and its presentation are © 2026 Center for Economics & Foreign Affairs. To republish it, see our republication terms. Republishing
Share
The Cefa Brief · applied.thecefa.org/cefa-brief/exports-one-step-then-four-flat-years · Printed from the web edition