
РазъяснениеStates & Communities
Where an occupational wage estimate comes from
An occupational wage figure is a median, drawn from a survey of employers, for jobs located in one place. By the end you will know what the number leaves out, why the top of the scale is censored, and when two figures for the same occupation are not in conflict.
Prepared by
Last reviewed Published 3 minute read

Иллюстрация: The Cefa Brief
The figure quoted for what an occupation pays in a state usually comes from one federal survey. The Bureau of Labor Statistics asks establishments how many people they employ in each occupation and how those workers are distributed across a set of wage bands. The published estimate is a median: the wage at which half the jobs in that occupation pay more and half pay less. It is a statement about jobs, not about people, and about jobs where the work is done rather than where the worker sleeps.
Three consequences follow at once. The estimate covers the whole occupation in a state, from the first year of a career to the thirtieth, so it is not what a new hire is offered. It counts a job twice if one person holds two, and not at all if the person works for themselves. And because it is a median rather than a mean, it does not move when a handful of very large salaries are added at the top.
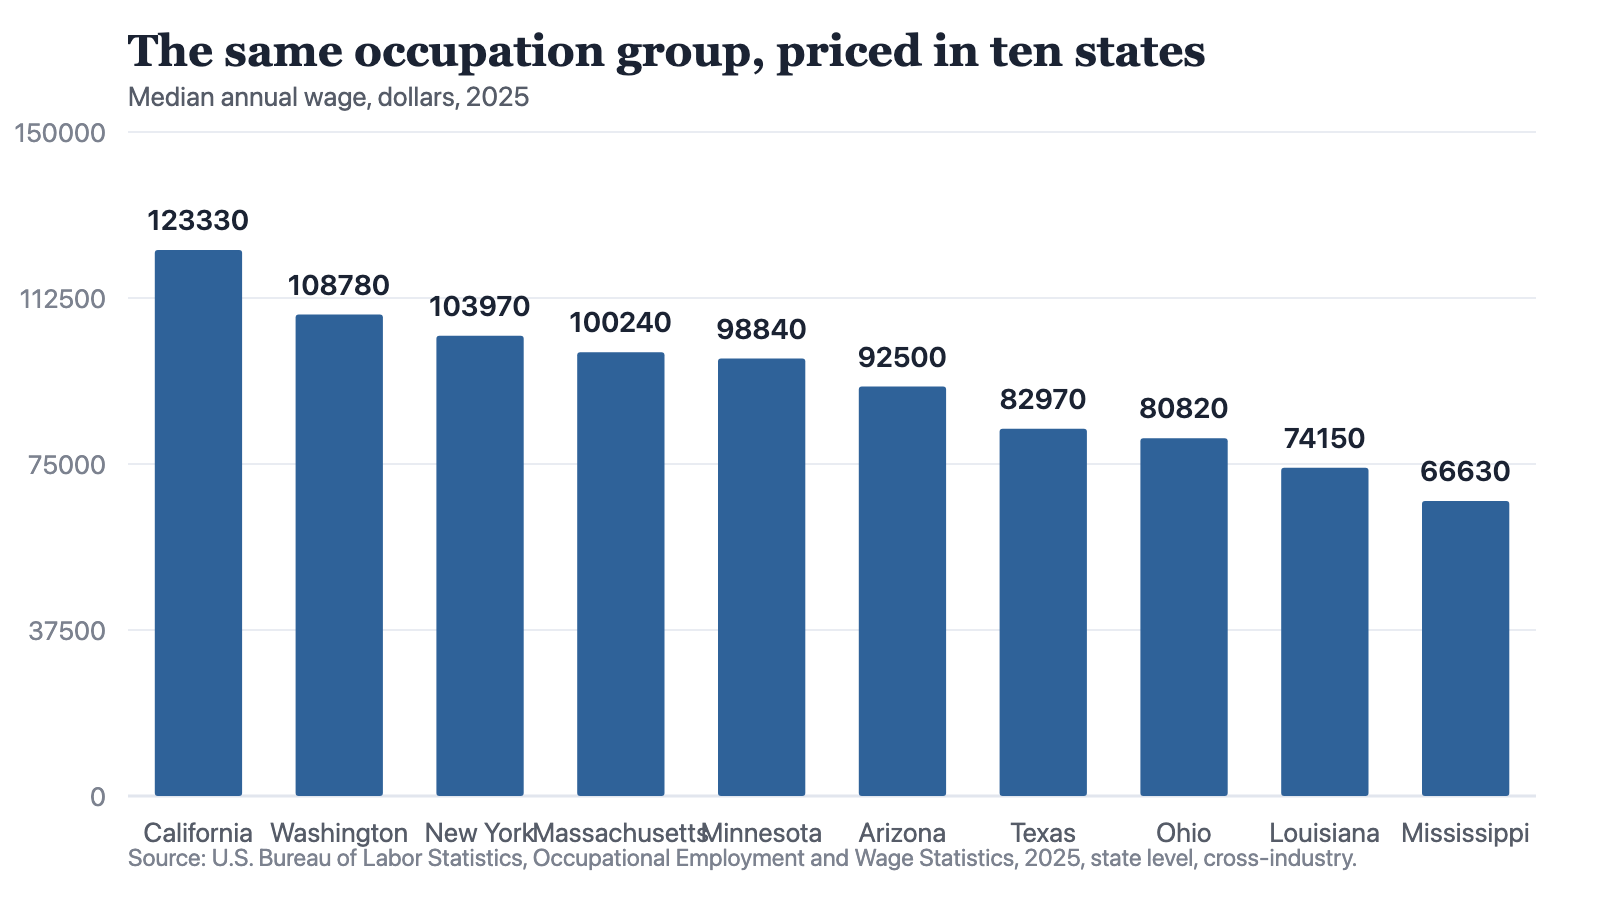
Notes: Source: U.S. Bureau of Labor Statistics, Occupational Employment and Wage Statistics, 2025, state level, cross-industry. Ten states shown to span the published range. Not adjusted for the cost of living.
Source: The Cefa Brief
Chart description
Ten bars, ordered from longest to shortest. California leads at 123,330 dollars. Washington follows at 108,780, then a closely spaced group of four: New York at 103,970, Massachusetts at 100,240, Minnesota at 98,840 and Arizona at 92,500. A clear step down leads to a second tight cluster: Texas at 82,970 and Ohio at 80,820. Louisiana sits lower at 74,150, and Mississippi closes the chart at 66,630. The overall shape is a steep top, a long flat middle where four states are almost indistinguishable, and a gentle decline to the foot. The last bar is a little over half the length of the first.
Ten bars, ordered from longest to shortest. California leads at 123,330 dollars. Washington follows at 108,780, then a closely spaced group of four: New York at 103,970, Massachusetts at 100,240, Minnesota at 98,840 and Arizona at 92,500. A clear step down leads to a second tight cluster: Texas at 82,970 and Ohio at 80,820. Louisiana sits lower at 74,150, and Mississippi closes the chart at 66,630. The overall shape is a steep top, a long flat middle where four states are almost indistinguishable, and a gentle decline to the foot. The last bar is a little over half the length of the first.
What the wage includes
The wage reported is straight-time gross pay. It takes in the base rate, cost-of-living allowances, guaranteed pay, hazard pay, incentive pay such as commissions and production bonuses, and tips. It leaves out premium pay for overtime, shift differentials, year-end and other nonproduction bonuses, severance, and the employer's cost of benefits. In occupations where overtime and night shifts are routine, and there are many in healthcare, logistics and construction, the published median therefore sits below what the same job actually deposits in an account over a year. Annual figures for hourly occupations are the hourly rate scaled to a full-time, full-year schedule, whether or not the people doing the work are given one.
Who is outside the survey
- The self-employed, and the owner-partners of unincorporated firms. A trade carried on largely by one-person businesses is thinly represented.
- Workers employed directly by private households.
- Unpaid family workers.
- Any cell where too few employers reported for an estimate to be released without exposing one of them. A blank is a suppression, not a zero.
Two further rules shape the ends of the scale. The Bureau does not publish a median above a ceiling, which in the current state estimates is 239,200 dollars; an occupation at that mark is reported as being at or above it rather than at any particular figure, so the published number is a floor. At the other end, an occupation with too few reporting employers in a small state is simply absent, and the gap should be read as an absence of a published estimate rather than an absence of the work.
A median wage describes a job in a place. It does not describe a worker, a household, or an offer.
Comparing one state with another
The chart prices a single occupation group in ten states, and the spread is wide. None of it is a defect in the survey. Wage levels differ because housing and everything else differs; because the mix of employers inside a group differs, and a state whose hospitals sit in two large metropolitan systems prices differently from one served by rural critical-access hospitals; and because licensure rules and bargaining coverage differ. Nothing here is adjusted for the cost of living, so a dollar in the chart is a dollar and not a basket of goods. Two states can rank in one order by wage and the opposite order by what the wage buys.
A test you can apply. When a wage figure is quoted for an occupation, ask four things. Is it a median or a mean? Does it describe the occupation across a state, or one employer's advertised post? Does it cover every level of experience, which the federal estimate does and a job advertisement does not? And is overtime part of the claim, because it is not part of the number. A figure that survives those four questions can be set beside another one. A figure that does not is a different quantity wearing the same name.
About the author
Each author told us that for this piece they hold no interest a reader would think relevant.
Explainers are written and kept up to date by The Cefa Brief’s editors. An Explainer is background CEFA stands behind. It is not one author’s argument, and it is not a CEFA position on what anyone should do. If something here is wrong or out of date, write to applied@thecefa.org.
© 2026 Center for Economics & Foreign Affairs. To republish it, see our republication terms. Republishing
Share
The Cefa Brief · applied.thecefa.org/cefa-brief/what-an-occupational-wage-estimate-is · Printed from the web edition