
Goods imports from China fell 11 billion dollars a month in 2025, taking the series below its 2020 level
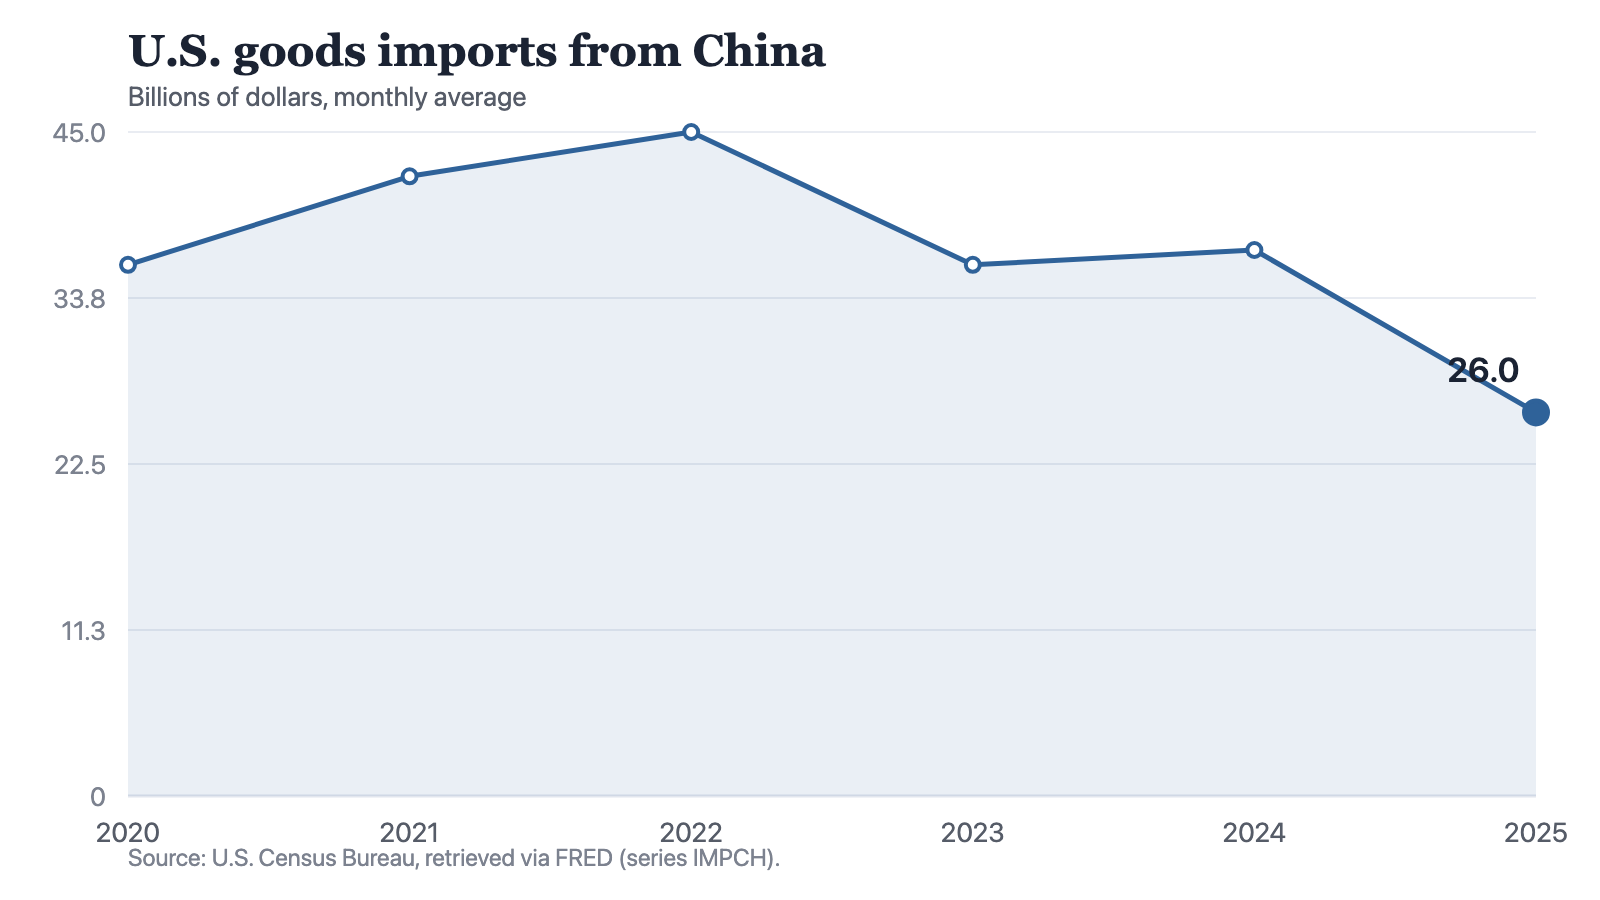
The monthly average rose from 36 billion dollars in 2020 to 45 in 2022, then fell to 26 in 2025, the lowest of the six readings. Exports in the other direction also ended at their lowest reading, so the narrower bilateral difference comes from buying less rather than selling more.
by
Published 2 minute read

Иллюстрация: The Cefa Brief
U.S. goods imports from China stand at 26 billion dollars a month in 2025. That is the lowest reading in the six years held on this site: 10 billion below the 36 billion recorded in 2020, and 19 billion below the 45 billion peak of 2022. The fall of 11 billion between 2024 and 2025 is the largest single-year change in the series in either direction.
The six readings, all monthly averages in billions of dollars, are 36 in 2020, 42 in 2021, 45 in 2022, 36 in 2023, 37 in 2024 and 26 in 2025.
Notes: Annual observations. Each point is the average of the periods within the year, not the year’s total.
Source: The Cefa Brief
Chart description
A line chart of U.S. goods imports from China, as a monthly average in billions of dollars: 36 in 2020, 42 in 2021, 45 in 2022, 36 in 2023, 37 in 2024 and 26 in 2025. The line rises to its highest point in 2022, drops back to 36 in 2023, holds close to level at 37 in 2024, then falls further in 2025 to 26, the lowest point on the chart.
A line chart of U.S. goods imports from China, as a monthly average in billions of dollars: 36 in 2020, 42 in 2021, 45 in 2022, 36 in 2023, 37 in 2024 and 26 in 2025. The line rises to its highest point in 2022, drops back to 36 in 2023, holds close to level at 37 in 2024, then falls further in 2025 to 26, the lowest point on the chart.
Where the line breaks
Year on year the series added 6 billion, then 3, then gave back 9, then added 1, then gave back 11. There are two falls in the window and they are not the same thing. The fall of 9 billion in 2023 returned the series to its 2020 reading of 36 billion, and 2024 recovered 1 billion of it. The fall of 11 billion in 2025 goes through the 2020 level rather than back to it.
The other direction
Exports run on a far smaller scale and have moved far less. U.S. goods exports to mainland China, on the same monthly-average basis, are 10 billion dollars in 2020, 13 in 2021, 13 in 2022, 12 in 2023, 12 in 2024 and 9 in 2025. The 2025 reading is the lowest of that set, and it is 1 billion below where the window began.
Subtracting the stored export average from the stored import average, year by year, gives 26 billion in 2020, 29 in 2021, 32 in 2022, 24 in 2023, 25 in 2024 and 17 in 2025. That difference is at its widest in 2022 and at its narrowest in the final year. It narrows by 8 billion between 2024 and 2025, and it does so because imports fell 11 billion while exports fell 3. Both sides of the trade are at their lowest readings of the window in 2025. A narrower difference here is not evidence of selling more, and it is arithmetic on two separately compiled series rather than the published balance.
What the series does not carry
Two things about the measure itself. The unit is a monthly average, so each annual point is the average of that year's twelve months rather than the year's total, and 26 billion dollars is a monthly figure. And the series counts goods. Services trade in either direction is outside it, the figures are in dollars with no adjustment for prices, and nothing in the series states what the goods were or who made their components.
The most these two series support is narrow. Goods imports from China and goods exports to mainland China are both at their lowest readings of the window in 2025, and the movement is much larger on the import side. What they cannot settle is whether those goods stopped being bought or started arriving from somewhere else. Import series for other partners, or a breakdown by commodity, would separate the two. Neither is held here, and until one is, the fall of 11 billion is a fact about a single bilateral line and not a fact about supply chains.
Method and data
The figures are annual observations of U.S. goods imports from China, series IMPCH, and U.S. goods exports to mainland China, series EXPCH, both compiled by the U.S. Census Bureau, redistributed by FRED and retrieved for this site on 19 September 2026. Both are stated in billions of dollars as a monthly average, which means each annual point is the average of that year's months and not the year's total; reading 26 billion dollars as a year's imports would be wrong by roughly a factor of twelve. Both series cover goods only, so services trade in either direction sits outside them, and both are stated in dollars with no adjustment for prices, so a change mixes what was bought with what it cost. The two series are compiled separately and on their own bases; the differences between them quoted in the text are arithmetic performed here on the stored annual averages, and they are not the published bilateral goods balance. Nothing in either series identifies what the goods were, who made their components, or whether a good that once arrived directly from China now arrives from a third country.
How to cite
Jag DeSaint, "Goods imports from China fell 11 billion dollars a month in 2025, taking the series below its 2020 level," The Cefa Brief, Applied America, 22 июля 2025 г., https://applied.thecefa.org/cefa-brief/the-gap-narrowed-from-one-side.
About the author

Each author told us that for this piece they hold no interest a reader would think relevant.
This Insights piece carries its author's name because the view in it is the author's own. An editor reviewed it before publication, which is not the same as agreeing with it. It is not a position of the Center for Economics & Foreign Affairs or of Applied America.
© 2025. The author or authors hold the copyright in this Insights piece; CEFA publishes it with their permission. This edition, its editing and its presentation are © 2025 Center for Economics & Foreign Affairs. To republish it, see our republication terms. Republishing
Share
The Cefa Brief · applied.thecefa.org/cefa-brief/the-gap-narrowed-from-one-side · Printed from the web edition