
Producer prices fell in two straight years and are still below the 2022 peak
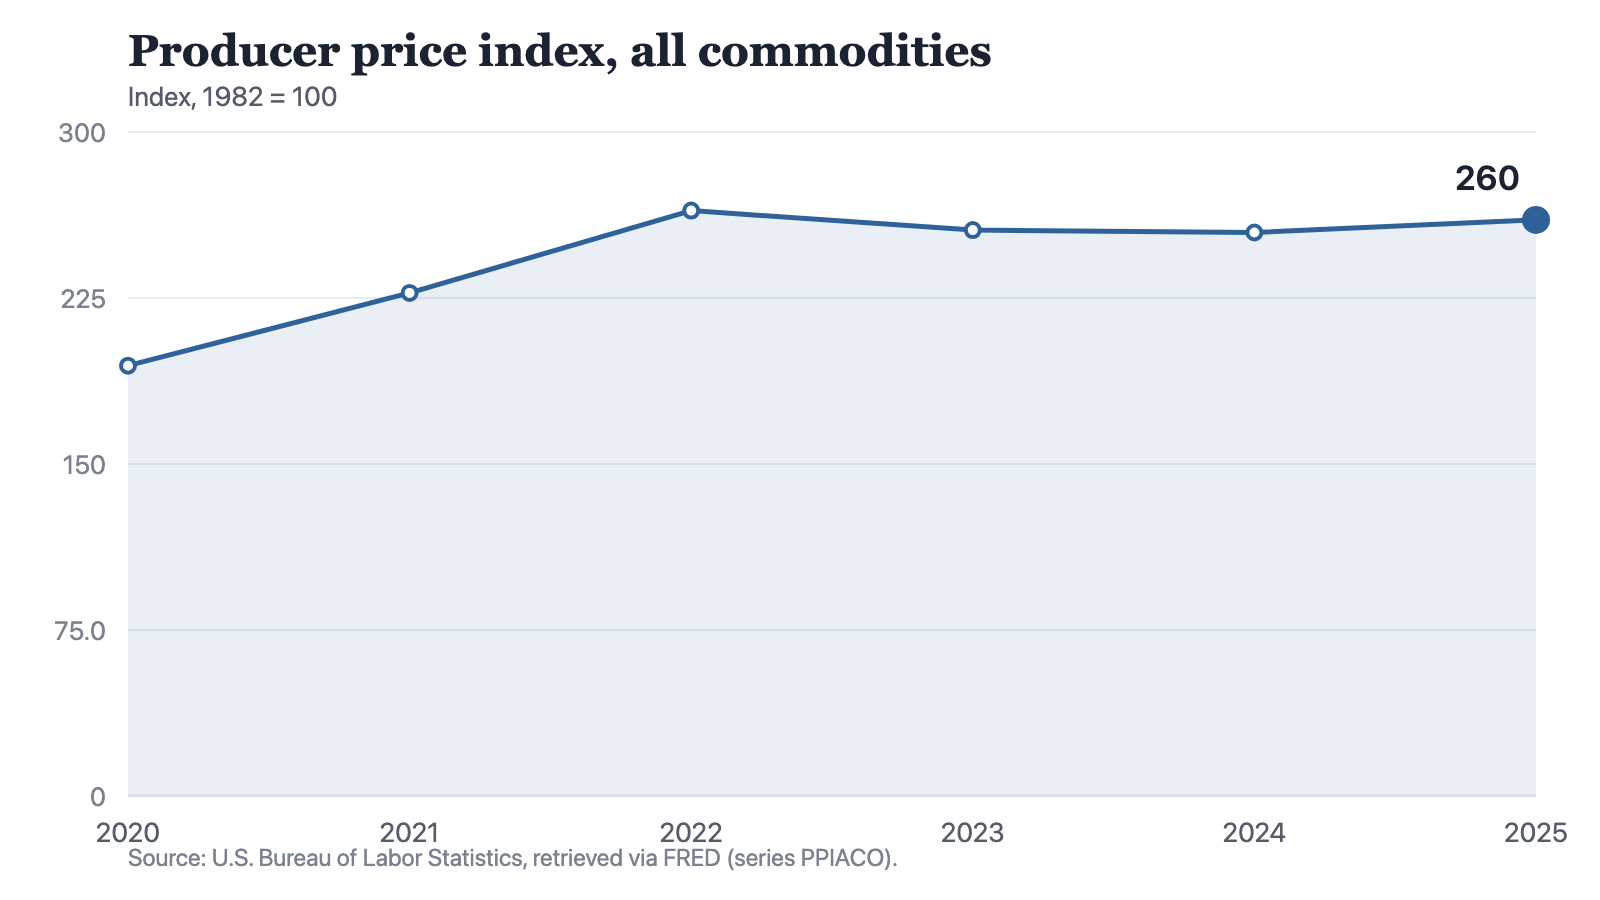
The all-commodities producer price index reached 264.5 in 2022, fell twice, and at 260.3 in 2025 has not regained it. It also sits 65.9 points above 2020.
by
Published 3 minute read

Иллюстрация: The Cefa Brief
Almost every American price series of the last five years tells the same story: a steep climb, then a flattening. The producer price index for all commodities is the exception in this set. It climbed, and then it actually went down, in two consecutive annual observations, and it has not recovered the ground it lost.
The six readings are 194.4 in 2020, 227.3 in 2021, 264.5 in 2022, 255.7 in 2023, 254.6 in 2024 and 260.3 in 2025. The peak is the 2022 figure. The latest figure is 4.2 points below it.
The climb, then the retreat
The two-year ascent is the largest movement in the series by a wide margin. From 2020 to 2021 the index rose 32.9 points, and from 2021 to 2022 another 37.2, a combined climb of 70.1 points in twenty-four months of observations. Nothing else in the window is of that order.
Notes: Annual observations. This is a producer-side index and is not the consumer price index; it measures a different set of transactions. All commodities is a wide aggregate and is not broken into components here.
Source: The Cefa Brief
Chart description
A line chart of the producer price index for all commodities. It rises sharply from 194.4 in 2020 to 227.3 in 2021 and peaks at 264.5 in 2022, then declines to 255.7 in 2023 and 254.6 in 2024 before recovering part of the ground to 260.3 in 2025. The 2025 point sits visibly below the 2022 peak.
A line chart of the producer price index for all commodities. It rises sharply from 194.4 in 2020 to 227.3 in 2021 and peaks at 264.5 in 2022, then declines to 255.7 in 2023 and 254.6 in 2024 before recovering part of the ground to 260.3 in 2025. The 2025 point sits visibly below the 2022 peak.
The retreat is smaller and it is uneven. The 2023 observation is 8.8 points below the peak. The 2024 observation is a further 1.1 points below that, a movement small enough that the two readings are close to indistinguishable at the scale of this series. Then 2025 turns back up by 5.7 points. Net of all three, the index gave back 9.9 points from its peak and took 5.7 of them back, leaving it 4.2 short.
So the finding has two halves and both are load-bearing. This index did fall, twice, which is a genuinely unusual thing for a price index to do and is the reason producer prices are worth reading separately. And the fall did not undo the climb, or anything close to it.
The two halves are best held together as one piece of arithmetic. The climb from 2020 to the 2022 peak was 70.1 points. The 2025 reading is 65.9 points above 2020. Of everything the index gained in those two years, almost all of it is still in the level. The retreat, read against the ascent that preceded it, is a trim.
What the index measures
It measures prices received by domestic producers. That is a different question from what households pay, and the two indices are not substitutes for one another. A reader who takes a fall in this series as evidence that living costs fell has changed the subject without noticing.
All commodities is also a very wide aggregate, and nothing in this series breaks it apart. The line cannot say which goods moved or by how much, which matters because an all-commodities aggregate is exposed to inputs that are priced on world markets rather than domestic ones. A single large component can move the whole index without much else changing, and this series gives no way to check whether that is what happened.
The observations are annual, so the shape between points is unknown. A peak in the middle of 2022 and a peak at its end produce the same dot on this chart.
Reading it as an input cost
For anyone pricing construction, equipment or long-dated supply, the useful comparison is not the retreat from 2022 but the distance from 2020. On that basis the index is 65.9 points higher than where the window opened, a level about 34 percent above it. A two-year decline from an elevated peak is still a level well above the one most existing contracts were written against.
This is the difference between a series that corrected and a series that stopped rising. Two falling observations look like a correction until you see what they fell from. The producer price level has come off its peak and remains, on the most recent reading available here, nearer to that peak than to where it started.
Method and data
The figures are annual observations of the producer price index for all commodities, published by the U.S. Bureau of Labor Statistics and redistributed by FRED, retrieved for this site on 19 September 2026. The index is stated on a 1982 base of 100.
The point changes quoted are differences between consecutive observations in that series. The statement that 2025 stands about 34 percent above 2020 is the ratio of the two published values, 260.3 against 194.4, with no adjustment.
This is a producer-side index. It measures prices received by domestic producers, not prices paid by households, and it is not the consumer price index. The two measure different transactions and are not interchangeable.
All commodities is a wide aggregate. Nothing here breaks it into components, so the series cannot say which goods moved, and annual observations carry no information about the path inside a year.
How to cite
Jag DeSaint, "Producer prices fell in two straight years and are still below the 2022 peak," The Cefa Brief, Applied America, 18 апреля 2025 г., https://applied.thecefa.org/cefa-brief/producer-prices-below-their-2022-peak.
About the author

Each author told us that for this piece they hold no interest a reader would think relevant.
This Insights piece carries its author's name because the view in it is the author's own. An editor reviewed it before publication, which is not the same as agreeing with it. It is not a position of the Center for Economics & Foreign Affairs or of Applied America.
© 2025. The author or authors hold the copyright in this Insights piece; CEFA publishes it with their permission. This edition, its editing and its presentation are © 2025 Center for Economics & Foreign Affairs. To republish it, see our republication terms. Republishing
Share
The Cefa Brief · applied.thecefa.org/cefa-brief/producer-prices-below-their-2022-peak · Printed from the web edition