
Healthcare employs more people at higher median pay than production work, which does not mean a transition has held anywhere
Summed across the fifty-one jurisdictions in the 2025 occupational file, healthcare practitioners outnumber production workers by 1,258,080, and in all fifty-one the practitioner median wage is the higher of the two. The jurisdiction most concentrated in that work has the third-lowest median wage of the fifty-one.
by
Vantage point
I am an analyst working from published statistics and public documents, and from nothing else. What that position gives is comparability. The same occupational measure, taken on the same basis in the same year, exists for all fifty states and the District of Columbia, and where an agency withheld a value the file records the absence rather than supplying a number. A reader can check every figure here against a named series on a stated date.
Published 6 minute read

Иллюстрация: The Cefa Brief
Where this is written from
I am an analyst working from published statistics and public documents, and from nothing else. What that position gives is comparability. The same occupational measure, taken on the same basis in the same year, exists for all fifty states and the District of Columbia, and where an agency withheld a value the file records the absence rather than supplying a number. A reader can check every figure here against a named series on a stated date.
There is a harder thing to say, and the subject makes it unavoidable. Nothing in this record is a city. No file held here carries a metropolitan, county or municipal figure; the finest geography anywhere in it is the state, and the state file used for this piece records a latest observation and one prior period rather than a run of years. So a piece about how cities change their economic base is written from a record with no cities in it. That rules out the case study, the before and after, and any claim that a particular place succeeded. What it leaves is the structure of the thing, which is what the measures are actually good for.
A base is a stock of occupations
An economic base is usually discussed as a set of firms or a set of buildings. Neither is measured here, and on reflection neither is the right object. The one file that distinguishes places from one another by economic structure is occupational: for each jurisdiction, the same twenty-two major groups, each with an employment count, a median wage and a location quotient, which the file defines in its own header as the occupation's share of that state's jobs divided by its share of national jobs, so that above 1 means more concentrated than the nation. Read that way a base is a stock of people holding particular occupations. Firms open and close inside a decade. A stock of people with training, licences, mortgages and school-age children does not, and that is the reason base transitions are counted in generations rather than in budget cycles.
The healthcare base is already the larger one
Sum the 2025 occupational file across its fifty-one jurisdictions and production occupations hold 8,565,750 workers. Healthcare practitioner and technical occupations hold 9,823,830, which is 1,258,080 more. Of the 155,495,750 jobs the file counts in all occupations across those jurisdictions, production is 5.5 percent and healthcare practitioners 6.3 percent. In 34 of the 51 jurisdictions, practitioners already outnumber production workers. Beneath that group sits a second one, healthcare support, with 7,901,660; the two healthcare groups together come to 17,725,490, about 2.07 times the production total. Those sums are arithmetic done here on published state values and are not agency national estimates.
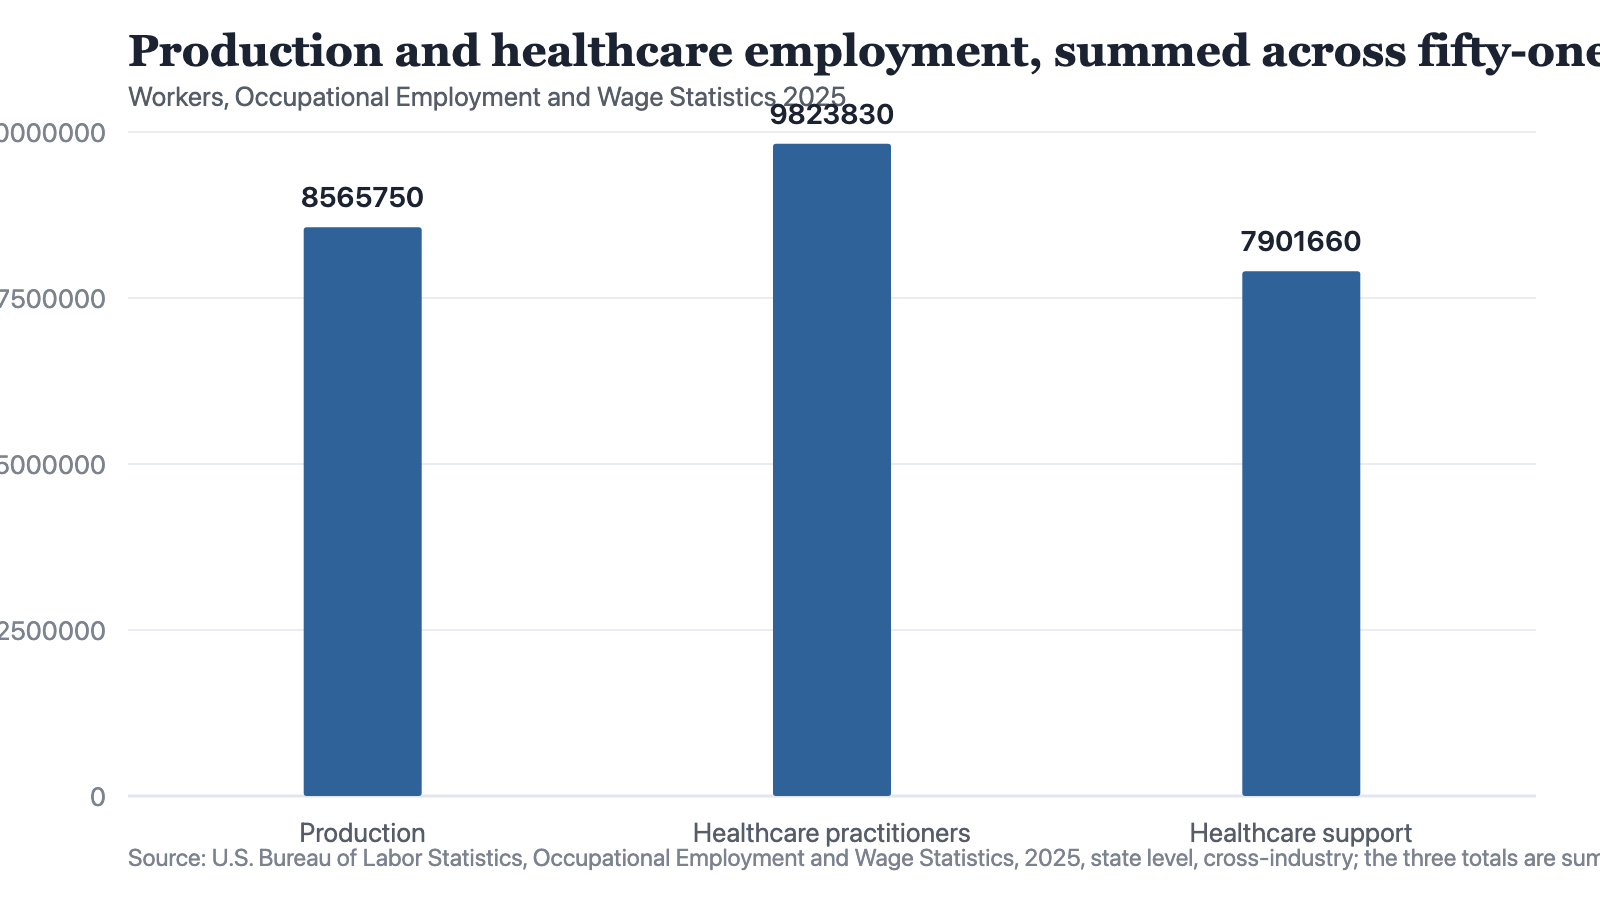
Notes: Occupational Employment and Wage Statistics 2025, state level, cross-industry. The three totals are sums of the fifty-one published state values performed for this piece, not figures published by the agency, and a sum of state estimates is not a national estimate. Major groups 510000, 290000 and 310000.
Source: The Cefa Brief
Chart description
A bar chart of three totals: production occupations 8,565,750 workers, healthcare practitioner and technical occupations 9,823,830 workers, and healthcare support occupations 7,901,660 workers. The healthcare practitioner bar is the tallest, standing 1,258,080 above production, and the healthcare support bar is the shortest, 664,090 below production.
A bar chart of three totals: production occupations 8,565,750 workers, healthcare practitioner and technical occupations 9,823,830 workers, and healthcare support occupations 7,901,660 workers. The healthcare practitioner bar is the tallest, standing 1,258,080 above production, and the healthcare support bar is the shortest, 664,090 below production.
Better paid in every state, and not therefore rich
The pay comparison is unusually clean. In all fifty-one jurisdictions the median wage of healthcare practitioner and technical occupations exceeds the median wage of production occupations. There is no exception to check. Oregon holds the two groups closer together than any other jurisdiction in the file, 108,000 in production against 108,210 practitioners, a difference of 210 jobs, and pays a median of 49,720 dollars in the first against 118,020 in the second, a gap of 68,300 dollars between two groups of the same size. Ohio is a heavier industrial state where production still leads, 451,510 against 409,590, with medians of 47,180 and 80,820. Michigan is further back again, 417,920 against 294,910, a difference of 123,010, on location quotients of 1.72 and 1.06. One year of data cannot show anyone moving between those groups. It shows the two stocks as they stood in 2025.
West Virginia is the case that disciplines the argument. It carries the highest healthcare practitioner concentration in the file, a location quotient of 1.45 and 91.857 of those jobs for every thousand in the state, against a production quotient of 0.88. In counts, 64,450 practitioners and 40,080 in healthcare support against 34,180 in production, so the two healthcare groups together are about 3.06 times the production group. Practitioners there earn a median of 76,530 dollars. And the state's all-occupation median wage is 45,300 dollars, the third lowest of the fifty-one, with healthcare support at 32,210, some 13,090 below that state median. The most thoroughly transitioned labour market in the file is also one of the poorest in it.
Every jurisdiction pays its healthcare practitioners more than its production workers. The one most concentrated in that work still holds the third-lowest median wage of the fifty-one.
The reason the wage comparison settles so little is that a job count cannot apply the test a base has to pass. What makes a sector a base is not what it pays but where its money comes from: whether it sells to people outside the local economy and brings their income in, or recycles income already there. The occupational file measures employment and wages. It records no revenue, no customer and no destination, so nothing in it can distinguish the two cases. That is the decisive question about any urban transition, and this record cannot answer it at any geography, let alone at the geography where it matters. I would rather state the gap than argue past it.
Movement, and somewhere to move to
Whatever else a transition is, it is a reallocation, and two national series measure the machinery of reallocation. The rate at which people quit a job runs 2.1 percent of employment in 2020, then 2.7, 2.8, 2.4, 2.1 and 2.0 in 2025, which is the lowest reading of the six and below where the window opened. Job openings, in millions at a monthly average, run 6.3, 10, 11.2, 9.3, 7.7 and 7.1, so the monthly average of vacancies is 4.1 million below its 2022 level. Each of those points is an average of that year's months and not a count of the openings a year held. Both series have fallen for three consecutive observations. The mechanism by which a worker leaves one base for another is, on the only evidence available, working more slowly than it did.
Then there is the cost of arriving. The national home-price index, on a January 2000 base of 100, runs 222.1 in 2020 and 328.5 in 2025, a rise of 106.4 points or 47.9 percent against its own 2020 value. Average hourly earnings over the same six observations go from 29.36 dollars to 36.44, a rise of 7.08 dollars or 24.1 percent against its own 2020 value. Those are two series in two units and neither has been divided by the other; each is measured against where it started. Housing units authorised by permit, in thousands at a seasonally adjusted annual rate, run 1,479, 1,734, 1,685, 1,516, 1,474 and 1,431, falling in each of the last four observations to a point 303 thousand below 2021 and 48 thousand below 2020. The thirty-year mortgage rate went from 2.96 percent in 2021 to 6.6 in 2025, 3.64 points higher. The median price of a new house sold fell from 433 thousand dollars in 2022 to 415 in 2025 while the price index rose 30.2 points, which is what happens when the median describes the houses that were built and sold rather than the price of housing.
So the conditions can be named even from here. A successor base must pay more than the one it would displace, and in the file healthcare practitioners do, in every jurisdiction. It must sell outward rather than recirculate income already present, and no series held here can test that at any geography. And the people doing the new work must be able to live within reach of it, which requires housing to be permitted, financed and built where the work is. Of those three, the first is published and settled. The second is published nowhere. The third is published as a national total and as a state total, and decided one municipality at a time. A transition holds or fails on the two that cannot be seen from this vantage, and precision about the first is not evidence about either. Naming that limit is more use to a reader than a confident sentence would be.
How to cite
Jag DeSaint, "Healthcare employs more people at higher median pay than production work, which does not mean a transition has held anywhere," The Cefa Brief, Applied America, 17 января 2025 г., https://applied.thecefa.org/cefa-brief/nothing-here-is-a-city.
About the author

Each author told us that for this piece they hold no interest a reader would think relevant.
This Perspectives piece carries its author's name because the view in it is the author's own. An editor reviewed it before publication, which is not the same as agreeing with it. It is not a position of the Center for Economics & Foreign Affairs or of Applied America.
© 2025. The author or authors hold the copyright in this Perspectives piece; CEFA publishes it with their permission. This edition, its editing and its presentation are © 2025 Center for Economics & Foreign Affairs. To republish it, see our republication terms. Republishing
Share
The Cefa Brief · applied.thecefa.org/cefa-brief/nothing-here-is-a-city · Printed from the web edition